A Good Story Well Told: Storytelling Components That Impact Science Video Popularity on YouTube
 Tianle Huang
 Will J. Grant
- Australian National Centre for the Public Awareness of Science, Australian National University, Canberra, ACT, Australia
Storytelling plays a crucial role in science communication, but little research has investigated how it impacts the popularity of science videos. This study examined storytelling components in 306 popular YouTube science videos and revealed significant relationships between video popularity and five storytelling components, namely dramatic question, insight, moments of change, emotional arousal and, status of story. Emotional arousal, in particular, showed a strong association with popularity. The results shed light on the role of storytelling in increasing science video popularity.
Introduction
The Internet has radically changed how people access information about science. The percentage of Americans citing the Internet as their primary source of science and technology news, for example, jumped from merely 9% in 2001 to 55% in 2016. By 2018, 69% of Americans preferred the Internet to television or newspapers to learn about specific scientific issues (National Science Board, 2018). With this profound change, science communicators are now facing an unprecedented range of both opportunities and challenges in influencing public knowledge and attitudes toward science (Brossard, 2013).
Amongst myriad forms of online information, video attracts much attention from the world's Internet users. Online videos accounted for 75% of all web traffic in 2017, and this is predicted to rise to 82% by 2022 (Cisco, 2018). The tremendous potential of online videos for public communication of science has been widely acknowledged amongst actors in the science community (Sugimoto and Thelwall, 2013; Erviti and Stengler, 2016; León and Bourk, 2018).
Central in this growth of online video is YouTube, a video-sharing platform garnering attention, in 2019, from over 1.9 billion logged-in users (YouTube, 2019). While there are many other popular online video websites on the Internet, YouTube is by far the biggest and arguably the most influential. In terms of traffic rank, YouTube is the second most-visited website on the web (Alexa, 2020). Many science channels have been launched on YouTube, by entities ranging from engineers (e.g., Mark Rober) to academic publishers (e.g., nature video), and many of them have gained significant popularity. The channel Kurzgesagt—In a Nutshell, for example, now has 12 million subscribers and almost a billion video views (Figures updated 26 May 2020). Meanwhile, anti-science groups and individuals are also using YouTube videos to publicize false, inaccurate, and potentially harmful information about science (Allgaier, 2013, 2020). The majority of YouTube videos on climate-related topics, for instance, have been shown to take a stance against the scientific consensus (Allgaier, 2019).
In this hyper-competitive environment, it is therefore crucial that researchers presenting content based on legitimate science identify factors that can increase the impact of science communication videos.
Researchers often divide factors that contribute to the popularity of online videos into content and content-agnostic factors. Content factors refer to the particular characteristics of the style and information of a video, such as topic, duration, and methods of delivery. Content-agnostic factors, meanwhile, are the characteristics independent of the production of the particular video, including social sharing applications, search engines, and recommendation systems. While both content and content-agnostic factors matter to video impact, understandings of content factors are especially valuable for science video creators. This is because the video content, rather than external influences like YouTube's recommendation algorithm, is something they can proactively change. Past research has found that factors such as emotional arousal (Berger, 2011; Nelson-Field et al., 2013), geographic relevance (Brodersen et al., 2012), duration (Gill et al., 2007), and host consistency (Welbourne and Grant, 2016) are related to video popularity.
Building on this, many have suggested that storytelling might play a critical role in successful video making (e.g., Leonhardt, 2015). Storytelling has also been widely seen as an ingredient of engaging science communication (Dahlstrom, 2014; Martinez-Conde and Macknik, 2017; Green et al., 2018). Yet little research has verified this in terms of science videos. In particular, it remains unclear how highly popular science videos tend to deploy different storytelling components to deliver content.
Hypothesizing that more popular videos amongst successful science YouTube channels would display particular storytelling aspects more frequently than their less popular counterparts, we compared storytelling components observed in highly popular and less popular science videos on YouTube. All videos examined were from science YouTube channels considered successful in terms of the breadth and engagement of their audience. Below, we provide some recommendations based on the results to help science communicators create popular YouTube videos about science.
Science Video Popularity and Storytelling
Content Factors Related to Science Video Popularity
In recent years, video has gained increasing importance as a tool to communicate science with publics (León and Bourk, 2018). On YouTube, whose viewership was projected to represent 78.4% of all digital video viewers in 2018 (eMarketer, 2018), several creators of science content have achieved broad popularity. For example, Vsauce, Mark Rober, Seeker, SmarterEveryDay, and Numberphile, five channels focusing on a wide range of science-related topics, have collectively attracted more than 43 million subscribers and 4 billion views (Socialblade, 2020f). What makes their science videos outstanding? Many answers to this question have been offered based on the experiences exchanged among practitioners (Brossard, 2013), but fewer are offered based on research on video content.
Previous studies have used several different approaches to assess the relationship between the content of online science videos and video popularity. Sugimoto et al. (2013), for example, looked into the influence of content presenters in TED videos, where science is one of their most popular topics. They examined 1,202 TED Talks and found that on YouTube, videos with male presenters garnered more views and likes than those with female presenters. Meanwhile, although academics only accounted for 21% of all presenters, their videos were more liked and more commented on than those from other backgrounds (Sugimoto et al., 2013).
Welbourne and Grant (2016) gave the first overview of videos specifically from science communication channels on YouTube and found other features that influenced video popularity. Their content analysis of 390 videos indicated that videos with a regular host had more views than those without, probably because a consistent communicator provides a natural anchor for the audience to connect with the channel. Overall, the authors found user-generated content (UGC), whose content delivery was significantly quicker, was more popular than professionally generated content (PGC). Viewers may favor a fast-paced video as a rapid pace of delivery could serve to enhance audience focus as well as persuasiveness (Welbourne and Grant, 2016). In a similar vein, Gheorghiu et al. (2017) showed that viewers were more likely to watch videos about scientific work if the presenters were scientists with an “interesting” facial appearance.
Nevertheless, when Erviti and Stengler (2016) used semi-structured interviews to explore how professional YouTube video producers, also known as YouTubers, make science communication videos, few factors mentioned above were noted by the interviewees. Regarding components that make a video successful, the five interviewees, who ran eight of the most successful science channels in the UK, suggested a series of content factors including bizarre topics, excellent production quality, likable characters, and visually amazing content the viewers have not seen before (Erviti and Stengler, 2016).
To identify the characteristics of popular science videos, Morcillo et al. (2016) collected the newest and the most popular videos from 100 successful science channels and analyzed the defining content factors of those videos, including narrative characteristics. The results showed that most of the examined videos used first-person narrative, advanced intro and outro sequences and complex montages, and that their production quality demonstrated a trend toward professionalism.
More importantly, Morcillo et al. (2016) also demonstrated that popular videos used complex storytelling structures to deliver video content. Most of them used techniques such as setting up a conclusive ending to intensify the dramatic energy of the video at the end, often answering questions formulated earlier in the video. Half of the examined videos contained more than two cause-and-effect turns, or plot points, in the narration. The authors concluded that popular videos shared a focus on storytelling, and most of those successful YouTubers were excellent storytellers (Morcillo et al., 2016).
Potential of Storytelling for Science Communication
Storytelling is the art of telling a story, but the answer to what a story is depends on whom is asked. Scholars have proposed various definitions of story and explored the relationship between story and other relevant terms like narrative (Prince, 1973; Chatman, 1978; Ricoeur, 1980; Stein, 1982; Cortazzi, 1994; Norris et al., 2005; Fludernik, 2009; Sanford and Emmott, 2012). In this study, we refer to a narrative as a series of chronologically ordered events in which earlier ones cause later ones. Following the work of Prince (1973), we define a story as a state-event(s)-inverse state change sequence of human interest, with the first state preceding the event and the event causing the change of state. Under these definitions, stories are essentially a subtype of narratives.
Various cultures use stories as a way to access and achieve popularity. Research studying a current hunter-gatherer population has shown that stories appear to facilitate cooperation within a camp, and people in hunter-gatherer societies prefer skilled storytellers as social partners even to hunters (Smith et al., 2017). For more than twenty years, educators have been using storytelling in digital formats to enhance students' engagement, learning motivation, and in some settings, academic performance (Hung et al., 2012; Yang and Wu, 2012; Smeda et al., 2014; Niemi and Multisilta, 2016). Even YouTube has stressed the value of storytelling to grow audience and bolster engagement in their tutorials in video-making (YouTube, 2017).
Scientists have also noticed the potential of storytelling for delivering effective science communication to non-expert audiences (Dahlstrom, 2014). Reviewing the role of story structure in creating meaning, context, relevance, and empathy for the audience, Haven (2007) asserted that a story “is a uniquely powerful and effective communications tool that can be put to use by virtually anyone.” Studies have shown that exposure to stories can induce a series of neurobiological effects in humans. For example, well-structured stories appear to induce similar brain activities not only among viewers (Hasson et al., 2008) but also between the storyteller and the audience (Stephens et al., 2010). These mechanisms indicate that telling stories can be a useful way to engage a broad audience with science. As a general recommendation, Olson (2018) contended that science communicators should equip themselves with the ability to “tell a concise, interesting, and entertaining story that also conveys substance” to reach public audiences and win their favor.
In addition to its ability to evoke interest and engagement (Green, 2004), storytelling can also enhance persuasion. Dahlstrom and Ho (2012) argued that stories are persuasive by nature because they are driven by a cause-and-effect structure, which makes the end of the story appear to be inevitable. Several studies have suggested that increased viewer involvement in a story can make the story more persuasive (Slater and Rouner, 2002; Slater et al., 2006; Moyer-Gusé, 2008; Tal-Or and Cohen, 2010; Hoeken et al., 2016). More recently, researchers have looked into narrative persuasion on science-related issues. Cooper and Nisbet (2016), for instance, found that stories can induce emotional responses that influence one's risk perception of environmental hazards. It appeared to be particularly effective when the goal of communication is to inform the audience about environmental hazards. As involvement in the story increased, negative emotions increased among the audience, which resulted in higher risk perceptions (Cooper and Nisbet, 2016). However, when a story on environmental issues was used in combination with a related explicit persuasive appeal, the combination was considered less persuasive than the story alone (Moyer-Gusé et al., 2019). More determinants of narrative persuasion and interactions between them are yet to be identified.
While both audience engagement and persuasiveness are important for public communication of science, our current research focuses on the former: what is the role of storytelling in increasing the audience engagement with science videos? To shed light on this topic, we collected a sample of science videos from science channels that are widely viewed and subscribed on YouTube, and examined different storytelling components within them, while controlling for content-agnostic factors. In the next section, we explore the storytelling components examined in detail.
Storytelling Components in Science Videos
Storytelling can be examined via analysis of a family of different content components, and different storytelling components may have vastly different contributions to the popularity of a story according to the medium, genre, and the storyteller's goal.
Lambert et al. (2003) summarized seven fundamental elements of digital storytelling, the practice of using multimedia technology to tell a story. They include a point of view from which the story is told, a dramatic question that identifies issues to be addressed and stimulates interest, emotional content that engages the audience affectively, a voice that contextualizes the story in a personal sense, soundtracks that suit and enhance the mood of the story, the economy of information that ensures only the minimum of narrative components necessary is used to tell the story and pacing that sustains the viewer's attention. Landry and Guzdial (2008) employed this framework to a useful end on YouTube. Investigating the 100 most popular YouTube videos, the authors showed that whereas most of them contained voice and emotional content, less than half of the samples contained a soundtrack, and only 10% employed a plot-based structure (Landry and Guzdial, 2008). These results highlight the fact that different storytelling components are not equally used by YouTubers to make their videos successful.
More recently, Finkler and Leon (2019) used a literature-based approach to identify key storytelling components. They produced a short video about whale watching based on a conceptual storytelling framework for science videos, which included six components—have a Simple core message; surprise audiences with an Unexpected question; use Concrete words to describe; provide information through Credible figures; evoke positive Emotions; link Science with the audience's interest and use an “And, But, Therefore” (ABT) Storytelling structure (SUCCESS). Then, they surveyed 1,698 individuals for the video impact and found a majority of viewers considered the video was telling a story, and more than 80% of respondents reported the video as engaging, informative, real, and believable. Moreover, 68.8% were likely or very likely to tell someone else about the video (Finkler and Leon, 2019). This finding indicates that the adoption of storytelling components proposed by the literature can indeed boost the effectiveness of a science video in reaching the audience and potentially changing attitudes.
Building on the work of Lambert et al. (2003) and Finkler and Leon (2019), instead of using only one variable to assess the role of storytelling in a video, we sought to establish a series of fundamental components of storytelling to test their influence on video popularity in a large sample. To that end, we established a literature-based list of storytelling components along seven dimensions listed below.
Narrative Point of View
Every story needs a teller. The narrative point of view represents the relationship between the storytellers, or narrators, and the stories they deliver. In a first-person narrative, the narrator is a character in the story, whereas in a third-person narrative, the narrator refers to the characters using third-person pronouns or directly by names. Finally, in a second-person narrative, “you” serve as the protagonist of the story. In this case, the intended audience could perceive themselves as undergoing the experience described by the narrator (Fludernik, 2009).
Different narrative points of view have different communicative stances. Morcillo et al. (2016) suggested that first-person narrative could help build a personal connection between the narrator and the viewer. The authors suspected that some science YouTubers used the third-person narrative out of a pursuit of entertainment value and innovation. However, the third-person narrative could also generate a sense of objectivity and is thus especially useful for explaining historical events. While Morcillo et al. (2016) didn't address the proportion of second-person narratives in science videos, we took it into account in this study as a second-person narrative could enhance interactivity between YouTubers and the viewers.
Use of Voice
Whereas writers tell stories through texts in print media, YouTubers often harness the power of their own voices to share stories. Lambert et al. (2003) proposed that the voiceover is “the foundation of any digital story.” The use of voice reflects the relationship between the auditory and visual narration of a video, and therefore shapes the delivery style of the video.
Welbourne and Grant (2016) identified several video styles pertaining to the use of voice. For example, vlogs often see the presenter talking directly to the camera, whereas in voice-over-visual videos, the presenter speaks over static or animated images.
Dramatic Question
The dramatic question refers to one single question that identifies the core issues to be resolved by the end of the video. It sets the tension of the content to be presented (Lambert et al., 2003; Lambert and Hessler, 2018).
This component is in close relationship with narrative appetite, a much more commonly seen concept in narratology. Narrative appetite is the desire of the audience to know more about what happened in a story. Storytellers raise and sustain narrative appetite through techniques such as suspense (Norris et al., 2005). In science videos, one of the common ways YouTubers seek evoke curiosity and interest is by asking a question that sounds uncommon, bizarre, or dramatic. For example, the question raised by Dr. Derek Muller in his YouTube channel Veritasium—why are 96,000,000 black balls on this reservoir?—perhaps helped to attract more than 48 million views to the video (Veritasium, 2019). In this case, asking the right question for a science video to address serves as an effective way to generate narrative appetite. We hypothesized that whether or not the narrator clarifies the dramatic question could make a difference in video popularity.
Moments of Change
A moment—or moments—of change serves as a crucial element of storytelling in multiple theories of story. The occurrence of moments of change in a science video can be considered a rough proxy for the complexity of its narration. In the structure of narratives theory developed by Labov and Waletzky (1997), moments of change are embedded in the complicating action, introducing disruptions into normality. Similarly, Lambert and Hessler (2018) also stressed the importance of identifying a moment of change with which the storytellers can clarify the insight of their story.
Importantly, some have argued that too few or too many moments of change in a narration could compromise the effectiveness of science communication. For example, Olson (2015)—in discussing his “And, But, Therefore” (ABT) structure—suggested both the “And, And, And” (AAA) and “Despite, However, Yet” (DHY) story structures make poor storytelling models. In the ABT structure, the word of contradiction “but” signals the moment of change in the narration. For comparison, the expository AAA structure involves no moment of change and is thus susceptible to monotony; the overly contradictory DHY structure, on the other hand, fails to convey a concise message, overwhelming the audience with too many moments of change (Olson, 2015).
Insight
Every story is told for a purpose. ElShafie (2018) specified the point of telling a story being to share a meaning or a broad theme. This theme is often learned as an insight embedded in the subtext, but sometimes they can be revealed by the narrator, too. For example, YouTuber Sally Le Page made a 5-min video showing nothing but herself numbering dozens of Petri dishes (Le Page, 2017). But when she revealed the insight that some of a scientist's job is painstakingly mundane, done to better understand the world, the otherwise dull scene in the video became meaningful.
Lambert and Hessler (2018) considered clarifying the insight of the story as the first step of digital storytelling. They argued that insight is the treasure of a story, and storytellers control how many clues the audience has to find it (Lambert and Hessler, 2018). Could how YouTubers deal with the insight of their stories influence how the audience understands and accepts the content they see? We predicted that a popular video is more likely to have an outspoken revelation of the insight.
Emotional Arousal
Emotional arousal is widely considered as one of the underlying dimensions of emotion. It refers to the intensity of emotional stimuli, ranging from soothing or calming to agitating or exciting (Russell, 1980). For example, a person getting angry often experiences an increased heart rate, while a sad person feels less sensorially alert. In this pair of emotions, anger is of higher arousal than sadness. Generally, high arousal emotions include anger, fear, anxiety, excitement, and awe, whereas emotions such as sadness, calmness, and boredom belong to the low arousal end.
Previous studies have shown that content that evokes high emotional arousal, regardless of the valence of the emotions, is more likely to be shared than low-arousal inducing content (Berger, 2011; Berger and Milkman, 2012; Nelson-Field et al., 2013). In our study, we examined whether videos inducing higher emotional arousal were more likely to gain higher views.
Status of Story
Status of story refers to the extent to which story drives the proceeding of the video. Texts used in public communication of science can be categorized into four main kinds: argumentative text, expository text, expository text embedded in a narrative, and narrative (Avraamidou and Osborne, 2009). The role played by stories varies in these texts, and science communicators are likely to use different forms of text for different audiences or purposes.
A few recent studies have examined the status of story in science videos. Davis and León (2018) analyzed the narrative features of 826 videos on the topics of climate change, nanotechnology and vaccines. They found that only 5.3% used a traditional three-act structure of storytelling with a situation set-up at the beginning, a complication in the middle, and a resolution at the end. The vast majority of videos still relied on an expository structure to present science (Davis and León, 2018). Davis et al. (2020) further made two otherwise identical science videos to compare the effects of an expository text and an infotainment text with a story structure. Their results indicated that the expository style was better liked and perceived as more believable, whereas the story-structured infotainment style was found easier for viewers to recall presented information and more likable among viewers without a university degree.
In this study, we used status of story to distinguish videos that are made to tell a story from those driven by non-story texts. This measure allowed us to tell apart different levels of the narrative-expository mixture and characterize how popular science YouTubers use stories in their videos. It's important to note that, as it has been specifically designed for assessing science videos, this storytelling component is more subjective than some of the others mentioned above.
To any specific individual, what constitutes “good storytelling” is, by its nature, subjective. Many factors, including historical traditions, cultural styles, and individual aesthetic preferences, can shape a person's preference for a certain style of storytelling. Nevertheless, storytelling features shared by different pieces of content viewed by large groups of viewers could be reasonably considered “good” practice for content producers, as they might have been important in reaching that broad audience.
By coding and analyzing these seven components in science videos on YouTube, we addressed the following research questions:
1. Is there any difference in the presence and extent of storytelling factors between more and less viewed videos?
2. What characteristics of storytelling factors do the more viewed videos have in common?
Details of the coding process of these seven dimensions are described in the following Method section.
Methods
In this study, we used views shown on YouTube video pages as a proxy for the video's popularity. While several different measures could be used to understand the overall success of a YouTube video, some are susceptible to spammers (e.g., likes/dislikes) and some can only be read by the channel holder (e.g., watch time). In contrast, view counts—verified via a specific verification process developed by YouTube to count and authorize legitimate views (Google, 2020a)—offer the most accessible and reliable reflection of how popular a video is.
To assess the difference in the deployment of storytelling factors between more viewed and less viewed science videos while controlling for content-agnostic factors such as channel subscribers, we collected a group of successful science YouTube channels, and from these sourced both their most and least viewed science videos published in 2019. The storytelling components observed in the most viewed group were then compared with those in the least group. Given the broad definitions of science communication in academic literature and practice, in this study, we refer to a science video as (a) any educational, but not purely instructional, didactic or pedagogical video content, and (b) in any science field listed in the All Science Journal Classification Codes (Elsevier, 2020).
Channel and Video Procurement
We collected target channels from Socialblade, a website that tracks YouTube statistics. We sampled YouTube channels that produce science communication videos in English from the “Top 250 YouTubers” lists under the categories of “Education” and “Science and Technology” on Socialblade.
Each category contained three lists sorted by different parameters, namely the number of subscribers, video views, and SB Rank, a measurement developed by Socialblade that indicates the channel's influence. On 24 February 2020, we collected a total of 52 channels from those six lists of two categories (Socialblade, 2020a,b,c,d,e,f), with their numbers of uploads, subscribers, and total video views recorded. Overall, these channels can be taken as broadly representative of the most popular science YouTubers, although some other popular channels that produce science content fall outside of the two categories examined. For example, the YouTube channel “National Geographic” was categorized under the channel type “Entertainment” on Socialblade, which was determined by the classification of content of the channel's recent public videos.
Using ScrapeStorm (2020), a commercially available data-extracting tool, we obtained data on all videos published by the 52 channels from 1 January to 31 December 2019, resulting in a dataset with titles, URLs, release dates, and views of a set of 5,339 videos. We then looked for the most- and least-viewed science communication videos published by each channel. Choosing videos in this way assured that every sampled video came from a channel with well-established influence and that the overall content-agnostic factors, including video quality and the YouTuber's social network size, were controlled in the most- and least-viewed groups.
Initially, we aimed to collect the three most viewed and three least viewed science communication videos from each channel. Two channels, however, uploaded fewer than six science communication videos with accessible view counts in 2019. The channel Motherboard had four, so we used two with higher views and two with lower views. In the channel Vsauce, only three videos had visible views. In this case, we selected the most and least viewed videos.
In total, a final sample of 306 videos, 153 in the most-viewed group and 153 in the least-viewed group, were acquired for content analysis. To maintain consistency of selection, one author (TH) reviewed all videos for inclusion.
Content Analysis
For content analysis, we used a seven-item list of storytelling components to code the observable storytelling characteristics of each video. We looked for different storytelling patterns between the most-viewed group and the least-viewed group to shed light on the relationship between each component and video popularity. Justification for these components is included above; here we denote how each component was operationalized.
Narrative Point of View
This item checks the dominant narrative point of view of a video. A video is of the first-person narrative when the narrator uses the first-person pronouns to present events in which he or she is one of the characters (e.g., “I did this”) most of the time. When the narrator and the protagonist of the event presented are different individuals, and thus third-person pronouns are used most often (e.g., “She did that”), the video takes a third-person point of view. Lastly, the dominant use of the pronoun “you,” as if the narrator is telling the story to a narratee, indicates a second-person narrative in the video.
Use of Voice
The use of voice refers to the dominant way (>75% of video duration) the host uses their voice in the video. We categorized the use of voice into four types: none, voice-over visuals, speak-on-camera, and mixed.
When no vocal narration was involved in a video for most of its length (for example, some videos may only use text over static or animated visuals to report science news), we marked the use of voice as none. A video used voice-over visuals if the narrator primarily talked off-camera (i.e., without the viewer seeing his or her talking face) and over visuals such as animation. If the narrator mostly talked on camera, either directly to it or not, the video was designated speak-on-camera. Lastly, when a video had multiple ways of using voice, and none of them accounted for >75% of the time, we categorized it as mixed. We recorded the length of the video in seconds and used a stopwatch to examine the dominant use of voice.
Dramatic Question
A video has an explicit dramatic question if the host or producer directly states it in a complete question form, either in the narration or in the title. If the core issue discussed by the video was identifiable but not asked as a question, we coded the question as implicit. For example, if the narrator noted “How do black holes form?” in a video solely about black hole formation, the video had an explicit dramatic question. If the narrator instead mentioned “Black holes can only form under some bizarre conditions and here's how,” then the question was implicit. In cases where videos didn't reveal such a question in any form, we coded it as a video with no dramatic question.
Moments of Change
In this item we inspected the number of times (0, 1, 2, 3, or more) when the narrative of the video pivoted in a different direction, establishing a contradiction tension, or twist. A moment of change can refer to a moment when an unexpected event happens during the video, or when the narrator proactively ends the discussion on one topic and shifts to a new one. If the narration stays straightforward throughout the video, for example, in the case of a YouTuber briefly answering questions from the audience, then the video has no moment of change.
Insight
In this study, the insight item documents the way the channel producers clarify the point of each video. Storytellers, probably in particular science storytellers, tell stories to make a point. The farmer and the viper from Aesop's Fables, for example, warns of the consequences of being kind to the wicked. We examined whether a video addresses the insight in an explicit way, an implicit way, or does not mention it at all.
Emotional Arousal
Emotional arousal refers to the level of physiological activation evoked in viewers by the content. Here, we followed a four-point Likert scale to rate the level of arousal induced by the video, based on the work of Bradley et al. (1992): inactive, a little bit active, moderately active, and quite active. Different levels of emotional arousal are shown in schematic form in Figure 1.
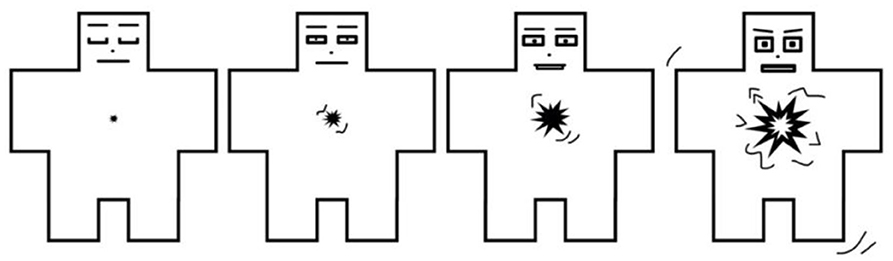
Figure 1. Schematic adapted from Bradley et al. (1992) showing different levels of emotional arousal. From left to right: inactive, a little bit active, moderately active, and quite active.
Status of Story
We rated the status of story in a video using a four-point Likert scale (None-Low-Medium-High). None: no story is told or shown through image during the entire video. Low: a story is told in a small part of the video and does not influence most of the remaining content. For example, a video may begin with a story about someone being frightened and talk about the science of fear without further responding to the story. Medium: stories are told now and then throughout the video, but most of them are unrelated. This form of storytelling is commonly seen in videos showcasing a list, such as “Top 10 science stories of 2019,” which may involve several independent stories. High: the whole video is used to tell or show one central story, which can contain multiple interrelated stories. It's important to note that a story can be presented through either narration or footage revealing what happened next.
Coding Procedure
To test intercoder reliability, two coders independently coded ten science communication videos selected from the sample. We numbered the 306 videos and used the Excel RANDBETWEEN function to generate ten different random numbers to make the selection. The values of Cohen's kappa (κ) for all seven categorical variables were ≥ 0.75, indicating an excellent agreement between coders (Fleiss et al., 2013). Weighted kappa was used for three ordinal items, namely moments of change, emotional arousal, and status of story.
Following this, a single coder (TH) manually viewed each video, coding each according to the seven criteria. To reduce the selection bias, the order of the videos was randomized using the Excel RAND function. Any promotional components to videos (for example, an in-video advertisement) was ignored.
Statistical Analysis
We used Microsoft Excel to carry out all statistical analyses. Student's t-test was used to determine whether data of the two groups were significantly different. When unequal variance was identified using Levene's test for homogeneity of variance, we used Welch's t-test in place of Student's t-test. The Chi-square statistic of independence was adopted to analyze differences between groups of nominal data. An alpha of.05 was used for significance in all tests. When the Chi-square result was significant, Cramer's V was used to assess the statistical strength (Cohen, 2013). All components with significant chi-square results were dummy coded and used as independent variables to perform a binary logistic regression.
Results
Video Views, Duration, and Age
We sampled 306 videos for content analysis, with 153 in the most-viewed group and 153 in the least-viewed. Videos in the most-viewed group, by definition, were viewed significantly more times [Mean (M) = 5.18 million (m) views, Standard Deviation (SD) = 8.04 m] than the least-viewed group [M = 0.59 m views, SD = 1.75 m, Welch's t(166) = 6.90, p < 0.01, Cohen's d = 0.79] (Figure 2A).
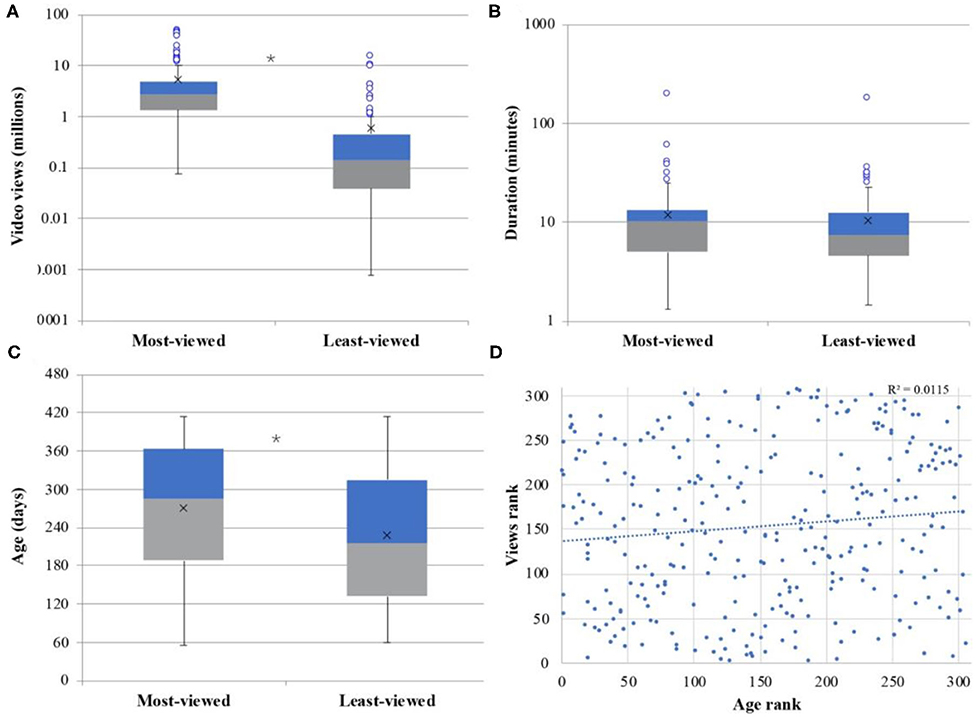
Figure 2. The distribution of video (A) views, (B) duration, and (C) age of sampled videos (N = 306). The relation between video age rank and views rank is shown in (D). Asterisks indicate a significant (p < 0.05) difference between the most-viewed group and the least-viewed group.
No significant difference was found in duration of videos between the most-viewed group (M = 11.90 min, SD = 16.79) and the least-viewed group [M = 10.47 min, SD = 15.39, Student's t(304) = 0.78, p = 0.44, Cohen's d = 0.09] (Figure 2B).
Even though all videos were published within one calendar year, videos in the most-viewed group (M = 271 days, SD = 101) appeared to be significantly older than those in the least-viewed group [M = 227 days, SD = 108, Student's t(304) = 3.68, p < 0.01, Cohen's d = 0.42] (Figure 2C). Despite this, Spearman's rank-order correlation suggested that the monotonic association between video age and video views was very weak [ρ(304) = 0.10, p = 0.06]. In other words, older video age doesn't necessarily mean a high number of views in the sample (Figure 2D). Examining how rapidly a YouTube video becomes popular, Figueiredo et al. (2011) found that, for a random YouTube video aged 1–12 months, it takes 79% of its video age to receive at least 90% of its views. For a highly popular video of the same age, the time was even shorter (Figueiredo et al., 2011). According to this observation, it's unlikely that videos in the least-viewed group would have gained views to overturn the significant difference in video views between the two groups, even if they were collected later so that both groups had the same average age. Therefore, we deemed the view difference caused by the difference in video age between groups to be negligible.
Storytelling Components
Chi-square tests were performed to compare proportions of videos in the most-viewed and the least-viewed group regarding (1) narrative point of view, (2) use of voice, (3) dramatic question, (4) moment(s) of change, (5) insight, (6) emotional arousal, and (7) status of the story (Table 1).
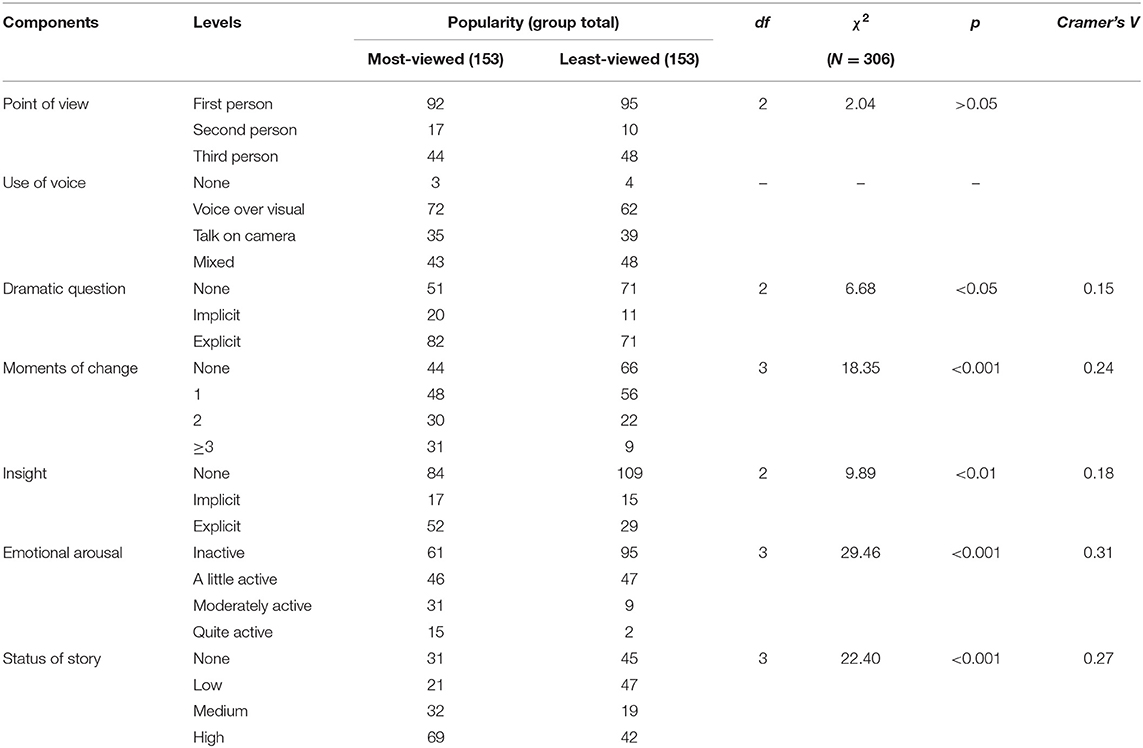
Table 1. Chi-square test results on proportions of storytelling components in two groups.
The narrative point of view did not differ between the groups [χ2(2, N = 306) = 2.04, p = 0.36], suggesting that narrative point of view has no significant impact on video popularity amongst successful YouTubers. Overall, the first-person point of view was most common (61%) in our sample, whereas only 8% adopted the second-person approach, which addresses the audience directly (Figure 3A).
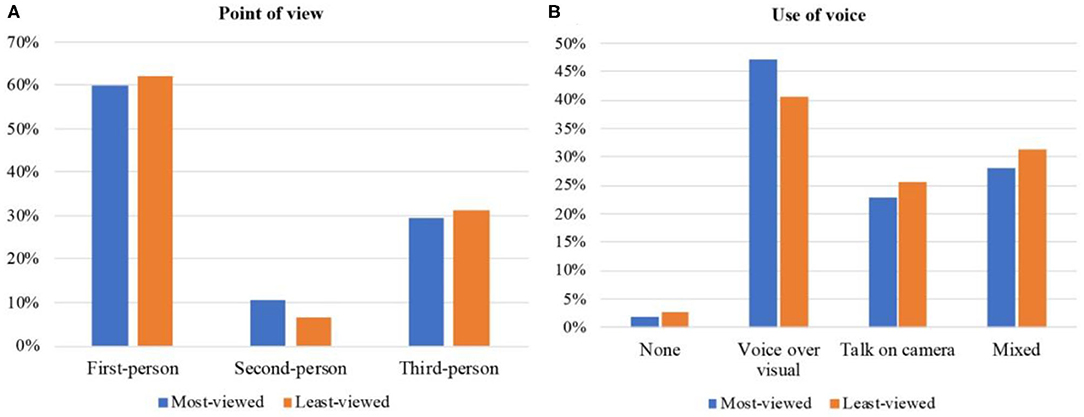
Figure 3. The percentage of videos with different (A) point of view, (B) use of voice in the most-viewed and least-viewed group.
Given the fact that only three videos in the most-viewed group and four in the least-viewed group involved little vocal narration, which violated one of the assumptions of Chi-square test, we used Fisher's exact test as an alternative. No significant difference was found between groups regarding the use of voice (p = 0.72). Most of the examined videos (>97%) used voice for narration, among which the voice-over visual was the most common narration style (Figure 3B). As before, these results suggest that the use of voice has no significant impact on video popularity amongst successful YouTubers.
A significant difference in the use of dramatic questions was found between the most-viewed and least-viewed groups, although the effect size was small [χ2(2, N = 306) = 6.68, p < 0.05, Cramer's V = 0.15]. The most-viewed group had significantly fewer videos without a dramatic question, and most videos in this group had an explicit dramatic question (e.g., World's Largest Jello Pool- Can you swim in Jello? by Mark Rober begins by directly asking, “What would it be like to actually belly flop in a pool of Jello?”). For both groups, videos with an implicit dramatic question were uncommon (Figure 4A).
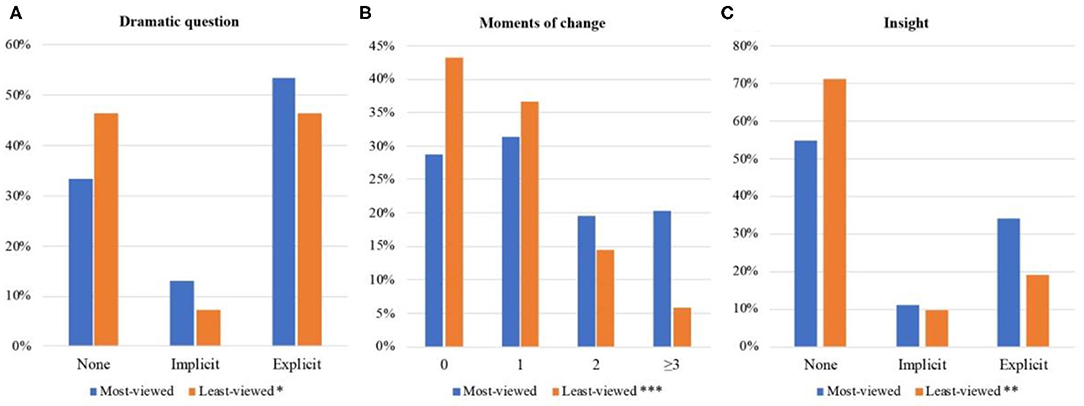
Figure 4. The proportions of videos with different types of (A) dramatic question, (B) moments of change (C) insight in the sample (N = 306). Asterisks denote a significant difference between the most-viewed group and the least-viewed group: *indicates p < 0.05; **indicates p < 0.01; ***indicates p < 0.001.
More importantly, the number of moments of change differed significantly between groups, with a medium effect [χ2(3, N = 306) = 18.35, p < 0.001, Cramer's V = 0.24]. Overall, videos in the most-viewed group were most likely to have one moment of change, whereas those in the least-viewed group most frequently had no moment of change at all. Plus, the most-viewed groups had significantly more videos with three or more moments of change than the least-viewed group (Figure 4B).
The proportion of insight also significantly differed between groups [χ2(2, N = 306) = 9.89, p < 0.01, Cramer's V = 0.18]. The most-viewed group had more videos that had an explicit insight than the least-viewed group (Figure 4C). In the video What if We Nuke a City? By Kurzgesagt—In a Nutshell, for example, the narrator clearly emphasized the importance of eliminating all nuclear weapons after demonstrating what would happen if a city was attacked with a nuclear weapon. Yet, most videos in the sample (55% of the most-viewed group and 71% of the least-viewed) had no insight (Figure 4C).
Videos in the most-viewed group also differed from those in the least-viewed group when it came to emotional arousal. The relationship was significant, and the effect size was large [χ2(3, N = 306) = 29.46, p < 0.001, Cramer's V = 0.31]. The least-viewed group had a higher percentage of emotionally inactive videos (~62%) than the most-viewed group (~40%). Meanwhile, 30% of videos in the most-viewed group were moderately or quite activating, whereas only 7% of the least-viewed group managed to induce such emotional arousal (Figure 5A).
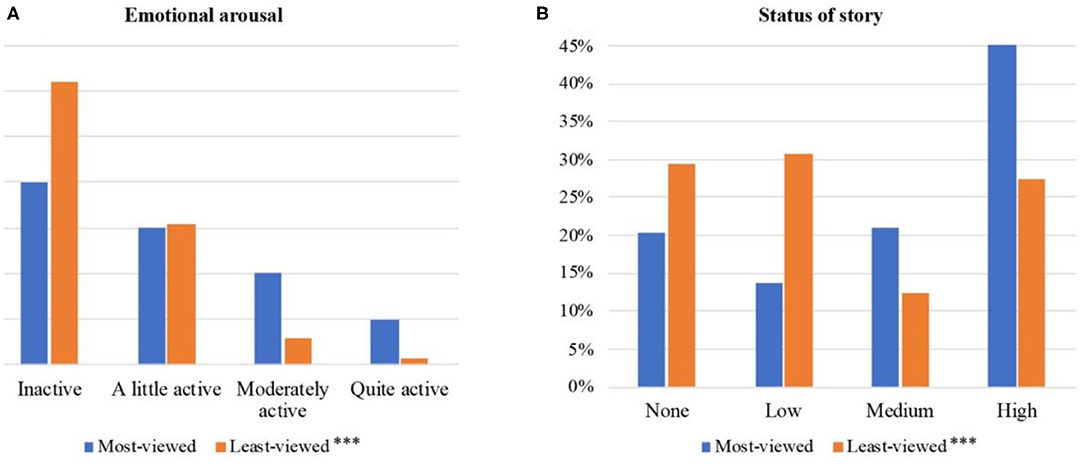
Figure 5. The proportions of videos with different types of (A) emotional arousal, and (B) status of story (N = 306). Asterisks denote a significant difference between the most-viewed group and the least-viewed group: *** indicates p < 0.001.
Lastly, status of story differed significantly between the two groups, and the effect size was medium [χ2(3, N = 306) = 22.40, p < 0.001, Cramer's V = 0.27]. The most-viewed group was more likely to have videos with medium (21%) or high (45%) status of story compared with the least-viewed group. For example, When Humans Were Prey by PBS Eons devoted the whole video to the story about the change of interpretation of the Taung Child fossil. Meanwhile, the least-viewed group had more videos without any story (29%) and videos whose status of story was low (31%) (Figure 5B).
Binary Logistic Regression
A binary logistic regression was performed to ascertain the effects of dramatic question, insight, moments of change, emotional arousal, and status of story on the likelihood that a science video belonged to the most-viewed group (i.e., was more popular). The logistic regression model was statistically significant, explaining 22.9% of variability of video popularity [Nagelkerke r2 = 0.229, χ2(13) = 57.693, p < 0.01].
The model indicated that emotional arousal and status of story were significant predictors of video popularity (p < 0.05). When the level of emotional arousal evoked by the video changed from lower than moderate (0) to moderate or higher (1), the odds of higher popularity is 2.998 times higher, if all other variables remained unchanged (95% CI: 1.237–7.265). More importantly, compared to videos with low status of story or no story at all (0), videos with medium or high status of story (1) were 3.163 times more likely to be more popular (95% CI: 1.378–7.262). Dummy variables representing the use of dramatic question, insight, and moments of change were non-significant predictors in this model (Table 2).
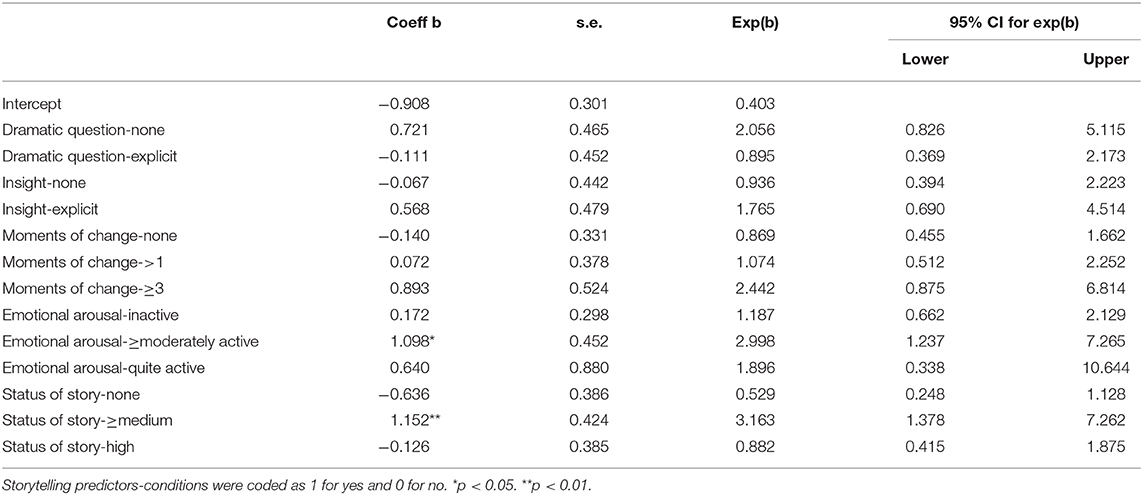
Table 2. Summary of binary logistic regression analysis for variables predicting video popularity.
The model correctly predicted 60.78% of cases where videos belonged to the most-viewed group and 71.24% of cases where videos belonged to the least-viewed group. Overall, the model provided an accuracy of prediction of 66.01%.
Features of the Most-Viewed Group
Correlations between storytelling components and video duration were found within the most-viewed group. A Chi-square test revealed a significant difference in the proportion of videos with different status of story across four categories of video duration [χ2(9, N = 153) = 31.02, p < 0.001, Cramer's V = 0.26]. As shown in Figure 6A, videos with high status of story accounted for over 30% of each duration category. Meanwhile, videos with no stories were more common in shorter videos than longer ones.
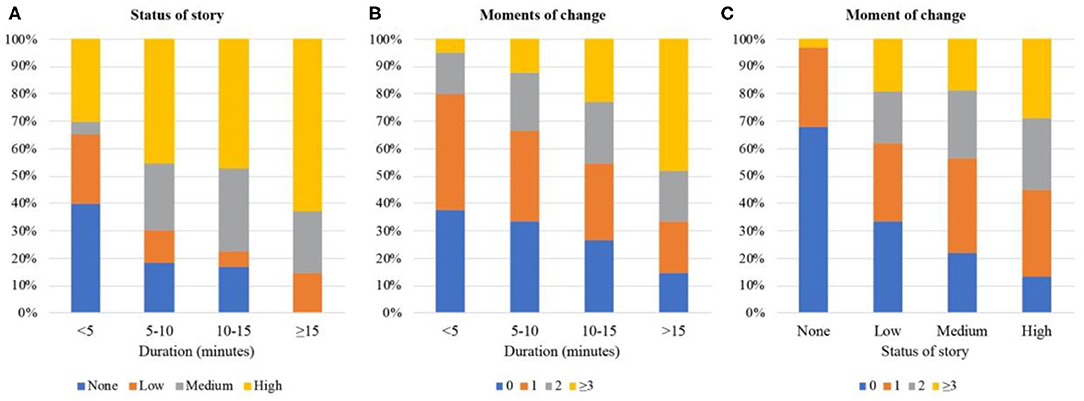
Figure 6. Relationship between (A) video duration and status of story, (B) video duration and moments of change, and (C) status of story and moment of change in the most-viewed group (N = 135).
As might be expected, the number of moments of change in videos also differed significantly across video duration [χ2(9, N = 153) = 23.36, p < 0.01, Cramer's V = 0.23]. Videos shorter than 15 min were most likely to have only one moment of change; videos longer than that typically had three or more moments of change (Figure 6B).
Moreover, we found a significant difference in the distribution of the number of moments of change across videos with different status of story [χ2(9, N = 153) = 29.46, p < 0.001, Cramer's V = 0.29]. Videos with a higher status of story were less likely to proceed without a moment of change in narration (Figure 6C).
Discussion
In this study, we examined 306 science communication videos published by 52 highly popular YouTube channels in 2019. By comparing seven storytelling components in the most viewed and least viewed videos from these channels, we found five of these factors significantly related to video popularity. Specifically, videos in the most-viewed group were more likely to identify a dramatic question to be addressed for the audience, incorporate at least one moment of change in the narration, specify the insight of the content presented, evoke higher-arousal emotions and elevate the importance of story in the video. The binary logistic regression model considering the five components (coded into 13 dummy variables in total) showed significant effects of emotional arousal and status of story on the probability of achieving a high video popularity.
Overall, our results indicate that the popularity of a science video is associated with storytelling, providing further emphasis on the role of storytelling in science communication. The present findings suggest a popular science video on YouTube is likely to be a 12-min story about an emotionally activating journey toward an answer to a science-related question raised at the beginning, with a twist in the middle and a revelation of the gist of the exploration at the end.
These features shed light on possible mechanisms of increasing science video popularity through storytelling. Among the examined relationships, the association between video popularity and emotional arousal was the only one that had a large effect size. This result hints that science videos evoking a higher level of emotional arousal in the audience are more likely to be popular. Previous studies have suggested that emotionally arousing content tends to elicit greater sharing (or intentions to share) amongst viewers (Berger, 2011; Berger and Milkman, 2012; Nelson-Field et al., 2013), which would certainly lead to more views in the long run. It is worth noting that the valence of emotions evoked is also suggested to make a difference between the popularity of online content (Berger and Milkman, 2012; Tellis et al., 2019). Cooper and Nisbet (2016) found that the relationship between stories and emotions varies according to the emotional valence of the story. To yield a deeper understanding of how storytelling may influence viewers' intention to share a video, future research should examine both the arousal and the valence dimension of the emotions involved.
Meanwhile, the use of dramatic questions, moments of change, insight revelation, and the use of one central story is also related to higher video popularity, although with small or medium effect sizes. These components could help to evoke and retain the attention of the audience, make sense of the information presented and create a mesmerizing experience for the viewer, which might also contribute to video popularity through promoting sharing.
Particularly, the number of moments of change appeared to be associated with both the status of story and video length. Within the most-viewed group, more than half (55%) of videos with a high status of story and 67% of videos longer than 15 min had two or more moments of change. A typical example that used twists to lead the audience to the next stop of the video was What Is The Scariest Thing? by Vsauce. Several times Michael Stevens, the host of the show, overturned previous candidates for “scariest thing,” Each twist was announced with a “but” to get the audience more captivated by the ultimate answer. Is such usage of moments of change an “overly narrative” form of storytelling, as Olson (2015) put it, or an application of multiple preferred ABT structures in one video? As the contexts and positions of the observed moments of change were not marked in this study, we can't determine whether each of them was effectively used according to Olson's framework. More work would need to be done to explore this question in depth.
Several limitations of this study constrain us from drawing more general conclusions about the impact of storytelling on science video popularity. Firstly, all our sampled videos were from a single video platform, YouTube. Generally, YouTube users are more likely to have a college degree than the general population, and more than 50% of YouTube users are female (Google, 2020b). But specific demographics of the viewers of the sampled channels, including age, gender, and geography, are accessible only to the channel holders. Therefore, while a large number of viewers watched the sampled videos, we can't take these viewers as fully representative of the wider consumer population of science videos. Secondly, to shed light on the practice by the most popular science YouTubers, we used extreme case sampling rather than probability sampling in this study. While results derived from these samples can be useful to guide future practice, a sampling approach could allow for better generalizability of findings. Thirdly, it's unlikely that our list of seven components has included all storytelling-relevant factors that contribute to video popularity. Viewers have inherently subjective perceptions of video content, and may well be attracted to the same content for different reasons. Asking viewers to compare pairs of videos with a similar topic on YouTube, Figueiredo et al. (2014) found that although viewers often disagree with each other's preference, they almost always made the right prediction of which video would be more popular on YouTube. Therefore, although it's extremely difficult, if not impossible, to identify all storytelling factors that have an impact on video popularity, it's worth searching. Future research should look at a wider range of storytelling-related variables for their impact on science video popularity. Lastly, through the chi-square test, we could only establish correlations rather than causal relationships between storytelling components and popularity. It doesn't necessarily imply that, for example, having more moments of change makes a video more popular. Further evidence on this point could be gathered via potential experimental conditions, or via gaining access to the audience reach and engagement data available only to the individual Youtuber or at the platform level.
Therefore, it is important to note a few things when interpreting the contribution of this study.
First of all, this study focuses on one goal of science communication, namely generating interest among non-expert audiences. Scheufele and Brossard (2008) contended that it might be unethical if we do not “use all tools at our disposal in order to reach broad audiences,” Here we intend to showcase the potential of storytelling in science videos as part of the toolkit of science communicators. But at the same time, while in this study we contrasted the most and least viewed groups to find “better” storytelling patterns that potentially facilitate higher video views, it doesn't mean that video popularity is the only—or even the most important—measure to define how successful a science communication video is.
Secondly, while our results revealed the most frequently displayed form of seven storytelling components in highly popular science videos, it doesn't necessarily mean that videos displaying these storytelling components will always be similarly popular. There are, of course, many other content and content-agnostic factors that contribute to video popularity. Having said that, videos that display the examined characteristics will, all other things being equal, be more likely to be popular. The question of how technically well or badly the YouTubers use these storytelling components is, while important, beyond the scope of our explorative study.
Last but not least, through looking into some of the most popular science channels, our study suggests the existence of a constant quest for good stories even amongst successful YouTubers. Although many of the YouTube science communicators explored in this study are excellent storytellers who are probably well aware of effective ways of composing a science story, they often fail to apply them equally in all their videos and make them equally narratively attractive. For example, the video When Giant Lemurs Ruled Madagascar had only one-tenth the view count of the video How We Domesticated Cats (Twice), even though they were both produced by PBS Eons and had highly similar traits over the seven storytelling components. Although we started to investigate the importance of the telling part of storytelling in video popularity, our finding hints at the unexamined impact of the story part of storytelling. Even for the most popular science YouTubers, it seems that there's an elusive dividing line between a well-told story and a great story. Finding a way to assess the latter, and more importantly, finding a way to produce it, will be challenging tasks for future researchers and science communicators to address.
Data Availability Statement
The raw data supporting the conclusions of this article will be made available by the authors, without undue reservation.
Author Contributions
TH devised the main conceptual ideas of the project, collected and analyzed the data, and drafted the manuscript. WG supervised the project, contributing to development and verification of the analytical methods, interpretation of the results, and the final version of the manuscript.
Conflict of Interest
The authors declare that the research was conducted in the absence of any commercial or financial relationships that could be construed as a potential conflict of interest.
References
Alexa (2020). The Top 500 Sites on the Web. Available online at: https://www.alexa.com/topsites (accessed May 26, 2020).
Allgaier, J. (2013). On the shoulders of YouTube: science in music videos. Sci. Commun. 35, 266–275. doi: 10.1177/1075547012454949
Allgaier, J. (2019). Science and environmental communication via online video: strategically distorted communications on climate change and climate engineering on YouTube. Front. Commun. 4:36. doi: 10.3389/fcomm.2019.00036
Allgaier, J. (2020). “Science and medicine on YouTube,” in Second International Handbook of Internet Research, eds J. Hunsinger, M. M. Allen and L. Klastrup (Dordrecht: Springer), 7–27.
Avraamidou, L., and Osborne, J. (2009). The role of narrative in communicating science. Int. J. Sci. Educ. 31, 1683–1707. doi: 10.1080/09500690802380695
Berger, J. (2011). Arousal increases social transmission of information. Psychol. Sci. 22, 891–893. doi: 10.1177/0956797611413294
Berger, J., and Milkman, K. L. (2012). What makes online content viral? J. Market. Res. 49, 192–205. doi: 10.1509/jmr.10.0353
Bradley, M. M., Greenwald, M. K., Petry, M. C., and Lang, P. J. (1992). Remembering pictures: pleasure and arousal in memory. J. Exp. Psychol. Learn. Memory Cogn. 18:379. doi: 10.1037/0278-7393.18.2.379
Brodersen, A., Scellato, S., and Wattenhofer, M. (2012). “Youtube around the world: geographic popularity of videos,” in Proceedings of the 21st International Conference on World Wide Web (New York, NY), 241–250. doi: 10.1145/2187836.2187870
Brossard, D. (2013). New media landscapes and the science information consumer. Proc. Natl. Acad. Sci. U.S.A. 110(Suppl. 3), 14096–14101. doi: 10.1073/pnas.1212744110
Chatman, S. B. (1978). Story and Discourse: Narrative Structure in Fiction and Film. Ithaca, NY: Cornell University Press.
Cisco, V. (2018). Cisco Visual Networking Index: Forecast and Trends, 2017–2022. Hoboken, NJ: White Paper.
Cohen, J. (2013). Statistical Power Analysis for the Behavioral Sciences. Cambridge, MA: Academic press. doi: 10.4324/9780203771587
Cooper, K. E., and Nisbet, E. C. (2016). Green narratives: how affective responses to media messages influence risk perceptions and policy preferences about environmental hazards. Sci. Commun. 38, 626–654. doi: 10.1177/1075547016666843
Dahlstrom, M. F. (2014). Using narratives and storytelling to communicate science with nonexpert audiences. Proc. Natl. Acad. Sci. U.S.A. 111(Suppl. 4), 13614–13620. doi: 10.1073/pnas.1320645111
Dahlstrom, M. F., and Ho, S. S. (2012). Ethical considerations of using narrative to communicate science. Sci. Commun. 34, 592–617. doi: 10.1177/1075547012454597
Davis, L. S., and León, B. (2018). “New and old narratives: changing narratives of science documentary in the digital environment,” in Communicating Science and Technology Through Online Video, eds B. León and M. Bourk (Abingdon: Routledge), 55–63. doi: 10.4324/9781351054584-5
Davis, L. S., León, B., Bourk, M. J., and Finkler, W. (2020). Transformation of the media landscape: infotainment versus expository narrations for communicating science in online videos. Public Underst. Sci. 29:688–701. doi: 10.1177/0963662520945136
Elsevier (2020). What is the Complete List of Scopus Subject Areas and All Science Journal Classification Codes (ASJC)? Available online at: https://service.elsevier.com/app/answers/detail/a_id/15181/c/10547/supporthub/scopus/kw/All+Science+Journal+Classification+Codes/ (accessed March 5, 2020).
ElShafie, S. J. (2018). Making science meaningful for broad audiences through stories. Integr. Comp. Biol. 58, 1213–1223. doi: 10.1093/icb/icy103
eMarketer (2018). Global Digital Video Viewers: eMarketer's Estimates and Forecast for 2016–2021, With YouTube and Mobile Video Numbers. Available online at: https://www.emarketer.com/Report/Global-Digital-Video-Viewers-eMarketers-Estimates-Forecast-20162021-with-YouTube-Mobile-Video-Numbers/2002185 (accessed August 15, 2019).
Erviti, M. C., and Stengler, E. (2016). Online science videos: an exploratory study with major professional content providers in the United Kingdom. J. Sci. Commun. 15, 1–29. doi: 10.22323/2.15060206
Figueiredo, F., Almeida, J. M., Benevenuto, F., and Gummadi, K. P. (2014). “Does content determine information popularity in social media? A case study of YouTube videos' content and their popularity,” in Proceedings of the SIGCHI Conference on Human Factors in Computing Systems (New York, NY), 979–982. doi: 10.1145/2556288.2557285
Figueiredo, F., Benevenuto, F., and Almeida, J. M. (2011). “The tube over time: characterizing popularity growth of youtube videos,” in Proceedings of the Fourth ACM International Conference on Web Search and Data Mining (New York, NY), 745–754. doi: 10.1145/1935826.1935925
Finkler, W., and Leon, B. (2019). The power of storytelling and video: a visual rhetoric for science communication. J. Sci. Commun. 18:A02. doi: 10.22323/2.18050202
Fleiss, J. L., Levin, B., and Paik, M. C. (2013). Statistical Methods for Rates and Proportions. Hoboken, NJ: John Wiley & Sons.
Fludernik, M. (2009). An Introduction to Narratology. New York, NY: Routledge. doi: 10.4324/9780203882887
Gheorghiu, A. I., Callan, M. J., and Skylark, W. J. (2017). Facial appearance affects science communication. Proc. Natl. Acad. Sci U.S.A. 114, 5970–5975. doi: 10.1073/pnas.1620542114
Gill, P., Arlitt, M., Li, Z., and Mahanti, A. (2007). “Youtube traffic characterization: a view from the edge,” in Proceedings of the 7th ACM SIGCOMM Conference on Internet Measurement (New York, NY), 15–28. doi: 10.1145/1298306.1298310
Google (2020a). How Video Views Are Counted. Available online at: https://support.google.com/youtube/answer/2991785 (accessed August 18, 2020).
Google (2020b). The Latest YouTube Stats on Audience Demographics: Who's Tuning In. Available online at: https://www.thinkwithgoogle.com/data-collections/youtube-viewer-behavior-online-video-audience/ (accessed August 18, 2020).
Green, M. C. (2004). Transportation into narrative worlds: the role of prior knowledge and perceived realism. Discourse Process. 38, 247–266. doi: 10.1207/s15326950dp3802_5
Green, S. J., Grorud-Colvert, K., and Mannix, H. (2018). Uniting Science and Stories: Perspectives on the Value of Storytelling for Communicating Science. Ottawa: Canadian Science Publishing. doi: 10.1139/facets-2016-0079
Hasson, U., Landesman, O., Knappmeyer, B., Vallines, I., Rubin, N., and Heeger, D. J. (2008). Neurocinematics: the neuroscience of film. Projections 2, 1–26. doi: 10.3167/proj.2008.020102
Haven, K. (2007). Story Proof: The Science Behind the Startling Power of Story. Westport, CT: Greenwood Publishing Group.
Hoeken, H., Kolthoff, M., and Sanders, J. (2016). Story perspective and character similarity as drivers of identification and narrative persuasion. Hum. Commun. Res. 42, 292–311. doi: 10.1111/hcre.12076
Hung, C. M., Hwang, G. J., and Huang, I. (2012). A project-based digital storytelling approach for improving students' learning motivation, problem-solving competence and learning achievement. J. Educ. Technol. Soc. 15, 368–379.
Labov, W., and Waletzky, J. (1997). Narrative analysis: oral versions of personal experience. J. Narrative Life Hist. 7, 3–38. doi: 10.1075/jnlh.7.02nar
Lambert, J., and Hessler, B. (2018). Digital Storytelling: Capturing Lives, Creating Community. Abingdon: Routledge. doi: 10.4324/9781351266369
Lambert, J., Hill, A., Mullen, N., Paull, C., Paulos, E., Soundararajan, T., et al. (2003). “Digital storytelling cookbook and travelling companion,” in Center for Digital Storytelling at the University of CA Berkeley (Berkeley, CA: Digital Diner Press), 9–19.
Landry, B. M., and Guzdial, M. (2008). Art or Circus? Characterizing User-Created Video on YouTube. Atlanta, GA: Georgia Institute of Technology.
Le Page, S. (2017). Science is Boring. YouTube. Available online at : https://www.youtube.com/watch?v=iXWHNvcK3jU (accessed April 20, 2020).
León, B., and Bourk, M. (2018). Communicating Science and Technology through Online Video: Researching a New Media Phenomenon. Abingdon: Routledge. doi: 10.4324/9781351054584
Martinez-Conde, S., and Macknik, S. L. (2017). Opinion: finding the plot in science storytelling in hopes of enhancing science communication. Proc. Natl. Acad. Sci U.S.A. 114, 8127–8129. doi: 10.1073/pnas.1711790114
Morcillo, J. M., Czurda, K., and Trotha, C. Y. R. V. (2016). Typologies of the popular science web video. J. Sci. Commun. 15, 1–32. doi: 10.22323/2.15040202
Moyer-Gusé, E. (2008). Toward a theory of entertainment persuasion: explaining the persuasive effects of entertainment-education messages. Commun. Theor. 18, 407–425. doi: 10.1111/j.1468-2885.2008.00328.x
Moyer-Gusé, E., Tchernev, J. M., and Walther-Martin, W. (2019). The persuasiveness of a humorous environmental narrative combined with an explicit persuasive appeal. Sci. Commun. 41, 422–441. doi: 10.1177/1075547019862553
National Science Board (2018). “CHAPTER 7 science and technology: public attitudes and understanding,” in Science and Engineering Indicators 2018 (Alexandria, VA: National Science Foundation), p. 29.
Nelson-Field, K., Riebe, E., and Newstead, K. (2013). The emotions that drive viral video. Austr. Market. J. 21, 205–211. doi: 10.1016/j.ausmj.2013.07.003
Niemi, H., and Multisilta, J. (2016). Digital storytelling promoting twenty-first century skills and student engagement. Technol. Pedagogy Educ. 25, 451–468. doi: 10.1080/1475939X.2015.1074610
Norris, S. P., Guilbert, S. M., Smith, M. L., Hakimelahi, S., and Phillips, L. M. (2005). A theoretical framework for narrative explanation in science. Sci. Educ. 89, 535–563. doi: 10.1002/sce.20063
Olson, R. (2015). Houston, We Have a Narrative: Why Science Needs Story. Chicago, IL: University of Chicago Press. doi: 10.7208/chicago/9780226270982.001.0001
Olson, R. (2018). “Don't be such a poor storyteller,” in Don't Be Such a Scientist (Washington, DC: Springer), 89–126. doi: 10.5822/978-1-61091-918-0_4
Prince, G. (1973). A Grammar of Stories: An Introduction. Berlin; Boston, MA: De Gruyter, Inc. doi: 10.1515/9783110815900
Russell, J. A. (1980). A circumplex model of affect. J. Personal. Soc. Psychol. 39, 1161–1178. doi: 10.1037/h0077714
Sanford, A. J., and Emmott, C. (2012). “Narrative and the rhetorical processing framework,” in Mind, Brain and Narrative, 1st Edn., eds A. Winnard, S. Green, E. Spicer, and C. Sarigiannidou (New York, NY: Cambridge University Press), 1–8. doi: 10.1017/CBO9781139084321.002
Scheufele, D. A., and Brossard, D. (2008). Nanotechnology as a moral issue? Religion and science in the US. Nanotechnology 21, 1–3.
ScrapeStorm (2020). AI-Powered Visual Web Scraping Tool. Available online at: https://www.scrapestorm.com/ (accessed February 24, 2020).
Slater, M. D., and Rouner, D. (2002). Entertainment—education and elaboration likelihood: understanding the processing of narrative persuasion. Commun. Theor. 12, 173–191. doi: 10.1111/j.1468-2885.2002.tb00265.x
Slater, M. D., Rouner, D., and Long, M. (2006). Television dramas and support for controversial public policies: effects and mechanisms. J. Commun. 56, 235–252. doi: 10.1111/j.1460-2466.2006.00017.x
Smeda, N., Dakich, E., and Sharda, N. (2014). The effectiveness of digital storytelling in the classrooms: a comprehensive study. Smart Learn. Environ. 1:6. doi: 10.1186/s40561-014-0006-3
Smith, D., Schlaepfer, P., Major, K., Dyble, M., Page, A. E., Thompson, J., et al. (2017). Cooperation and the evolution of hunter-gatherer storytelling. Nat. commun. 8:1853. doi: 10.1038/s41467-017-02036-8
Socialblade (2020a). Top 250 Youtubers Education Channels Sorted By Sb Rank. Available online at: https://socialblade.com/youtube/top/category/education (accessed February 24, 2020).
Socialblade (2020b). Top 250 Youtubers Education Channels Sorted By Subscribers. Available online at: https://socialblade.com/youtube/top/category/education/mostsubscribed (accessed February 24, 2020).
Socialblade (2020c). Top 250 Youtubers Education Channels Sorted By Video Views. Available online at: https://socialblade.com/youtube/top/category/education/mostviewed (accessed February 24, 2020).
Socialblade (2020d). Top 250 Youtubers Tech Channels Sorted By Sb Rank. Available online at: https://socialblade.com/youtube/top/category/tech (accessed February 24, 2020).
Socialblade (2020e). Top 250 Youtubers Tech Channels Sorted By Subscribers. Available online at: https://socialblade.com/youtube/top/category/tech/mostsubscribed (accessed February 24, 2020).
Socialblade (2020f). Top 250 Youtubers Tech Channels Sorted By Video Views. Available online at: https://socialblade.com/youtube/top/category/tech/mostviewed (accessed February 24, 2020).
Stein, N. L. (1982). The definition of a story. J. Pragmat. 6, 487–507. doi: 10.1016/0378-2166(82)90022-4
Stephens, G. J., Silbert, L. J., and Hasson, U. (2010). Speaker–listener neural coupling underlies successful communication. Proc. Natl. Acad. Sci U.S.A. 107, 14425–14430. doi: 10.1073/pnas.1008662107
Sugimoto, C. R., and Thelwall, M. (2013). Scholars on soap boxes: science communication and dissemination in TED videos. J. Am. Soc. Inform. Sci. Technol. 64, 663–674. doi: 10.1002/asi.22764
Sugimoto, C. R., Thelwall, M., Larivière, V., Tsou, A., Mongeon, P., and Macaluso, B. (2013). Scientists popularizing science: characteristics and impact of TED talk presenters. PLoS ONE. 8:e0062403. doi: 10.1371/journal.pone.0062403
Tal-Or, N., and Cohen, J. (2010). Understanding audience involvement: conceptualizing and manipulating identification and transportation. Poetics 38, 402–418. doi: 10.1016/j.poetic.2010.05.004
Tellis, G. J., MacInnis, D. J., Tirunillai, S., and Zhang, Y. (2019). What drives virality (sharing) of online digital content? The critical role of information, emotion, and brand prominence. J. Market. 83, 1–20. doi: 10.1177/0022242919841034
Veritasium (2019). Why Are 96,000,000 Black Balls on This Reservoir? YouTube. Available online at: https://www.youtube.com/watch?v=uxPdPpi5W4o (accessed August 20, 2020).
Welbourne, D. J., and Grant, W. J. (2016). Science communication on YouTube: factors that affect channel and video popularity. Public Understand. Sci. 25, 706–718. doi: 10.1177/0963662515572068
Yang, Y. T. C., and Wu, W. C. I. (2012). Digital storytelling for enhancing student academic achievement, critical thinking, and learning motivation: a year-long experimental study. Comput. Educ. 59, 339–352. doi: 10.1016/j.compedu.2011.12.012
YouTube (2017). Unleash the Power of Storytelling. Available online at: https://creatoracademy.youtube.com/page/lesson/nonprofits-story (accessed April 13, 2020).
YouTube (2019). YouTube for Press. Available online at: https://www.youtube.com/intl/en-GB/yt/about/press/ (accessed August 6, 2019).
Keywords: science video, YouTube, popularity, storytelling, content factor
Citation: Huang T and Grant WJ (2020) A Good Story Well Told: Storytelling Components That Impact Science Video Popularity on YouTube. Front. Commun. 5:581349. doi: 10.3389/fcomm.2020.581349
Received: 08 July 2020; Accepted: 17 September 2020;
Published: 19 October 2020.
Edited by:
Asheley R. Landrum, Texas Tech University, United StatesReviewed by:
Gianna M. Savoie, University of Otago, New ZealandLaura Rickard, University of Maine, United States
Copyright © 2020 Huang and Grant. This is an open-access article distributed under the terms of the Creative Commons Attribution License (CC BY). The use, distribution or reproduction in other forums is permitted, provided the original author(s) and the copyright owner(s) are credited and that the original publication in this journal is cited, in accordance with accepted academic practice. No use, distribution or reproduction is permitted which does not comply with these terms.
*Correspondence: Will J. Grant, will.grant@anu.edu.au