 Isabel Hamshaw1
 Anne Straube2
 Richard Stark3
 Laura Baxter3
 Mohammad T. Alam3†
 Walter J. Wever4Jun Yin4Yong Yue4
 Philippe Pinton4,5Aritro Sen4Gregory D. Ferguson4
 Andrew M. Blanks1,2*
- 1Clinical Science Research Laboratories, Division of Biomedical Sciences, Warwick Medical School, University of Warwick, Coventry, United Kingdom
- 2Centre for Mechanochemical Cell Biology, Division of Biomedical Sciences, University of Warwick, Coventry, United Kingdom
- 3Bioinformatics RTP, Warwick Medical School, University of Warwick, Coventry, United Kingdom
- 4Ferring Research Institute Inc., San Diego, United Kingdom
- 5Ferring Pharmaceuticals, International PharmaScience Center, Kastrup, Denmark
Preterm birth is the leading cause of infant morbidity and mortality. There has been an interest in developing prostaglandin F2α (PGF2α) antagonists as a new treatment for preterm birth, although much of the rationale for their use is based on studies in rodents where PGF2α initiates labour by regressing the corpus luteum and reducing systemic progesterone concentrations. How PGF2α antagonism would act in humans who do not have a fall in systemic progesterone remains unclear. One possibility, in addition to an acute stimulation of contractions, is a direct alteration of the myometrial smooth muscle cell state towards a pro-labour phenotype. In this study, we developed an immortalised myometrial cell line, MYLA, derived from myometrial tissue obtained from a pregnant, non-labouring patient, as well as a novel class of PGF2α receptor (FP) antagonist. We verified the functionality of the cell line by stimulation with PGF2α, resulting in Gαq-specific coupling and Ca2+ release, which were inhibited by FP antagonism. Compared to four published FP receptor antagonists, the novel FP antagonist N582707 was the most potent compound [Fmax 7.67 ± 0.63 (IC50 21.26 nM), AUC 7.30 ± 0.32 (IC50 50.43 nM), and frequency of Ca2+ oscillations 7.66 ± 0.41 (IC50 22.15 nM)]. RNA-sequencing of the MYLA cell line at 1, 3, 6, 12, 24, and 48 h post PGF2α treatment revealed a transforming phenotype from a fibroblastic to smooth muscle mRNA profile. PGF2α treatment increased the expression of MYLK, CALD1, and CNN1 as well as the pro-labour genes OXTR, IL6, and IL11, which were inhibited by FP antagonism. Concomitant with the inhibition of a smooth muscle, pro-labour transition, FP antagonism increased the expression of the fibroblast marker genes DCN, FBLN1, and PDGFRA. Our findings suggest that in addition to the well-described acute contractile effect, PGF2α transforms myometrial smooth muscle cells from a myofibroblast to a smooth muscle, pro-labour–like state and that the novel compound N582707 has the potential for prophylactic use in preterm labour management beyond its use as an acute tocolytic drug.
Introduction
Every year, 14.9 million babies are born preterm (<37 weeks gestation), representing 11.1% of live births (Chawanpaiboon et al., 2019). Preterm birth (PTB) is the leading global cause of infant morbidity and mortality, accounting for 18% of all deaths in children aged under 5 years old (Goldenberg et al., 2008; Mangham et al., 2009; Walani, 2020). The current treatment for treating life-threatening PTB is tocolytics, which include the calcium channel blocker, nifedipine, and the oxytocin receptor antagonist, atosiban (Vogel et al., 2014; Lamont and Jørgensen, 2019). Whilst these tocolytics can delay labour for ≤48 h, they do not prevent PTB and have shown limited improvement in both short-term and long-term neonatal outcomes (Schwarz and Page, 2003; Vogel et al., 2014; Lamont and Jørgensen, 2019).
The prostaglandin F2α (FP) receptor is a G protein–coupled receptor (GPCR) that is expressed in the human eye and myometrium and is upregulated during inflammation (Matsumoto et al., 1997; Mukhopadhyay et al., 2001; Beck et al., 2020) It is well established that prostaglandins play a dominant role during human parturition (Casey and MacDonald, 1988; Senior et al., 1993; Mitchell et al., 1995; Brodt-Eppley and Myatt, 1998; Gibb, 1998; Brodt-Eppley and Myatt, 1999; Olson, 2003). PGF2α directly stimulates contractions in myometrial smooth muscle via the FP receptor (Karim, 1968; Sharma et al., 1973; Lundström and Bygdeman, 1986; Kelly et al., 2009; Thomas et al., 2014). The binding of PGF2α to the FP receptor activates phospholipase C via Gαq, which converts the membrane-bound PIP2 to IP3 and DAG. The released IP3 binds to IP3 receptors on the sarcoplasmic reticulum, opening Ca2+ channels and increasing cytoplasmic concentrations of Ca2+ (Davis et al., 1987; Silvia and Homanics, 1988; Haddock and Hill, 2002). Ca2+ binds to calmodulin, which subsequently phosphorylates myosin light-chain kinase, leading to force generation and contraction (Kamm and Stull, 1985; Horowitz et al., 1996; Berridge et al., 2003; Wray and Prendergast, 2019).
In rodents, PGF2α initiates labour by regressing the corpus luteum and reducing systemic progesterone concentrations (Gross et al., 1998). The precise role of PGF2α in active human labour remains undetermined as humans do not experience reductions in systemic progesterone but instead may experience a “functional” progesterone withdrawal (Csapo and Pinto-Dantas, 1965; Merlino et al., 2007). However, maternal plasma levels of PGF2α increase in the third trimester prior to the onset of labour and increase further as labour progresses (reviewed by Wood et al., 2021). Therefore, while PGF2α can stimulate myometrial contractility, it may also play a role in uterine activation and the initiation of parturition.
In this study, we used our newly derived myometrial cell line, MYLA, to assess the novel FP antagonist, N582707 (Figure 1), in comparison to four compounds from the literature (Table 1). OBE002 is the parent compound of prodrug OBE022 (ebopiprant), which has been used for the treatment of preterm labour and is currently involved in Phase II clinical trials (Pohl et al., 2019). Compound 46/47 and compound 39/40 were investigated as potential treatments for idiopathic pulmonary fibrosis, with BAY-6672 (derived from compound 46) exhibiting anti-inflammatory and antifibrotic effects in induced pulmonary fibrosis mouse models (Beck et al., 2020). Similarly, compound 68 was designed for the treatment of inflammation and proved to be potent in FLIPR functional assays in transfected HEK-293 cell lines (Martos et al., 2016). We demonstrate that both Ca2+ release and Gαq coupling are inhibited by FP antagonists, with the novel FP antagonist, N582707, being more potent when compared to the previously published FP antagonists. Furthermore, through RNA-sequencing (RNA-Seq), we determined that PGF2α causes significant time-dependent changes in mRNA transcription, stimulating a phenotypic switch from a fibroblastic-like phenotype to a smooth muscle-like phenotype with an increase in the number of expressed pro-labour mRNAs. This effect was reversed by FP antagonism. This supports the hypothesis that PGF2α is not only important during labour to stimulate uterine contractions but also plays a significant role in transforming the myometrium from a quiescent to an activated state.
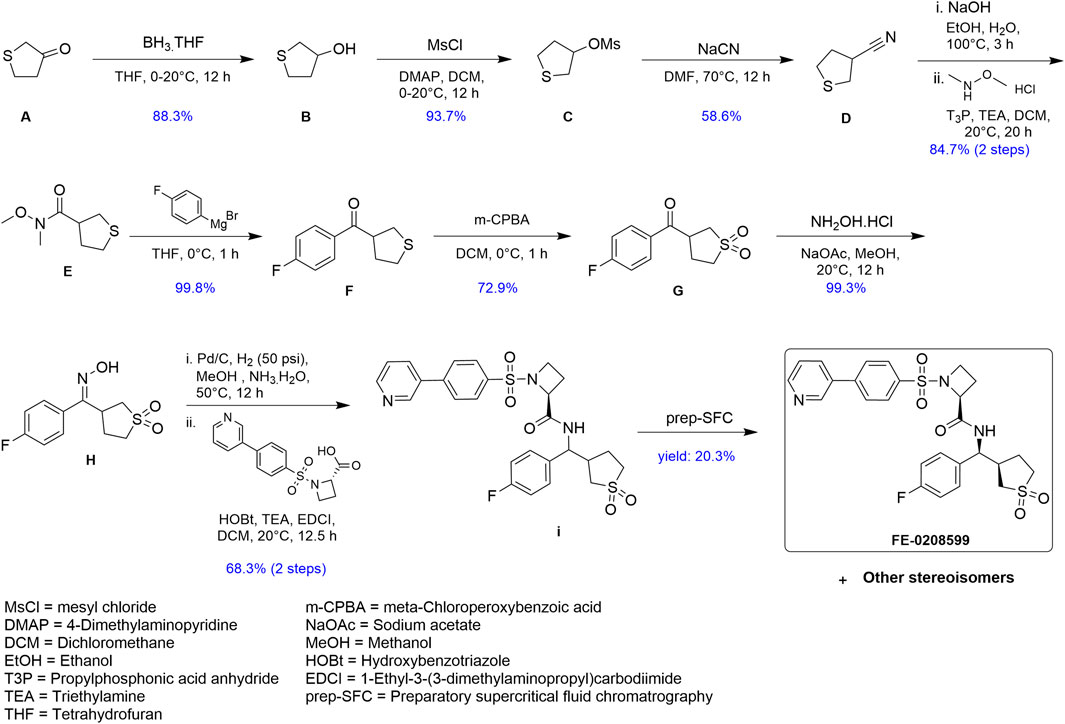
FIGURE 1. Schematic summary of the synthesis of N582707.
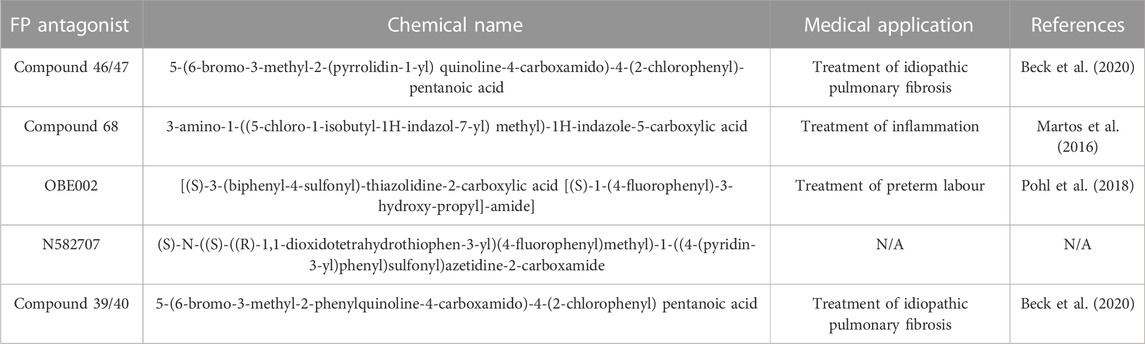
TABLE 1. List of FP antagonist chemical names and medical applications.
Results
To test the basic physiological response of our novel immortalised myometrial cell line (MYLA), we characterised FP receptor signalling by measuring intracellular Ca2+ concentrations post PGF2α stimulation. Increasing concentrations of PGF2α (10 half-log incremental concentration; 300 pM to 10 µM) evoked a concentration-dependent increase in the peak height (Fmax) and area under the curve (AUC) of individual intracellular Ca2+ oscillations and increased the frequency of Ca2+ oscillations as compared to basal values (Figure 2, Supplementary Materials S1, and Supplementary Materials S2). Concentration–response analysis revealed pEC50 values of Fmax 7.442 ± 0.18 (36.11 nM), AUC 7.498 ± 0.21 (31.74 nM) and frequency of 8.572 ± 0.20 (2.678 nM). Confidence intervals (CI), Emax, and HillSlope values (Table 2) were comparable to data observed in myometrial tissue in response to PGF2α (Phillippe et al., 1997).
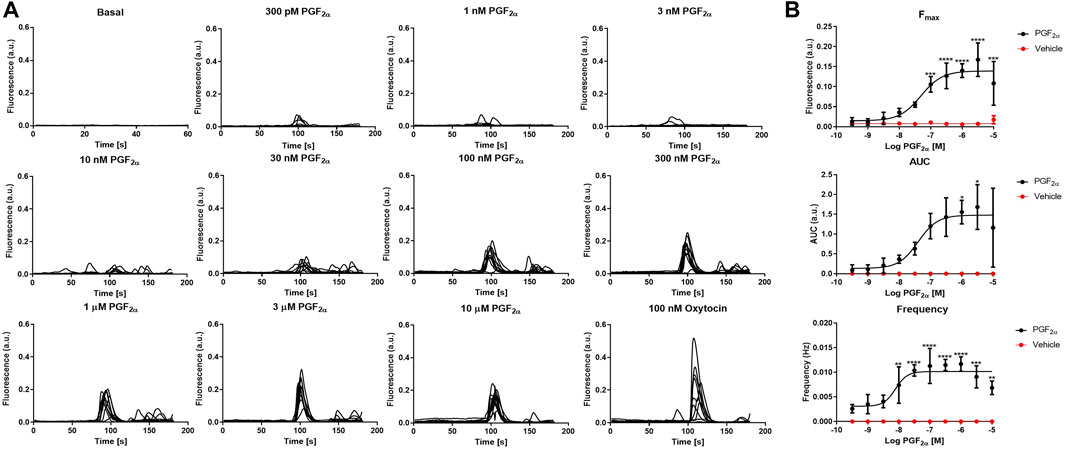
FIGURE 2. Effect of the FP agonist, PGF2α, upon calcium transients in MYLA cells. (A) Representative traces showing calcium transients in MYLA cells in response to increasing concentrations of PGF2α (300 p.m.–10 µM) plus a positive control of 100 nM oxytocin. (B) PGF2α (black circles) concentration–response curves and unstimulated/basal (red circles). Data were analysed to assess the peak responses (Fmax), the area under the curve (AUC), and peak frequency (Hz) during the 3 min of PGF2α stimulation. Data calculated as [(raw data − background) – minimum background]/averaged ionomycin Fmax. Data are mean ± SD, N = 3 (data were analysed by one-way ANOVA and Dunnett’s multiple comparison test comparing PGF2α treatment to basal, *p < 0.05, **p < 0.01, ***p < 0.001, and ****p < 0.0001). EC50, pEC50, CI, Emax, and Hill slope values obtained are shown in Table 2. Representative traces for the effect of the PGF2α vehicle (DMSO) are shown in Supplementary Materials S1. Statistical values are shown in Supplementary Materials S2.
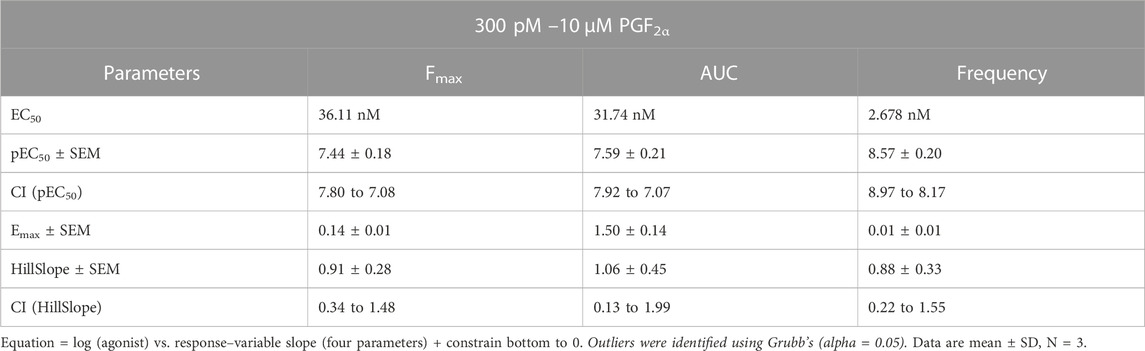
TABLE 2. Summary statistics for the effect of the FP agonist, PGF2α, upon MYLA cells, as depicted in Figure 1.
PGF2α stimulates FP receptor coupling to Gαq/11 in MYLA cells
It has previously been demonstrated that the FP receptor couples specifically to the Gαq subunit in mice, rats, and Chinese hamster ovary cells (Davis et al., 1987; Ito et al., 1994; Engstrøm et al., 2000; Le Gouill et al., 2010). To further characterise the MYLA cells, we investigated the coupling of the FP receptor to Gα-subunits by utilising the [35S]-GTPγS immunoprecipitation assay. PGF2α significantly increased [35S]-GTPγS binding to Gαq/11 only (Figure 3). However, PGF2α is promiscuous, binding not only to the FP receptor but also to other prostanoid receptors with relatively high affinity (Abramovitz et al., 2000). To demonstrate FP specificity, coupling to Gαq/11 was reversed by administration of the FP antagonist compound 39/40.
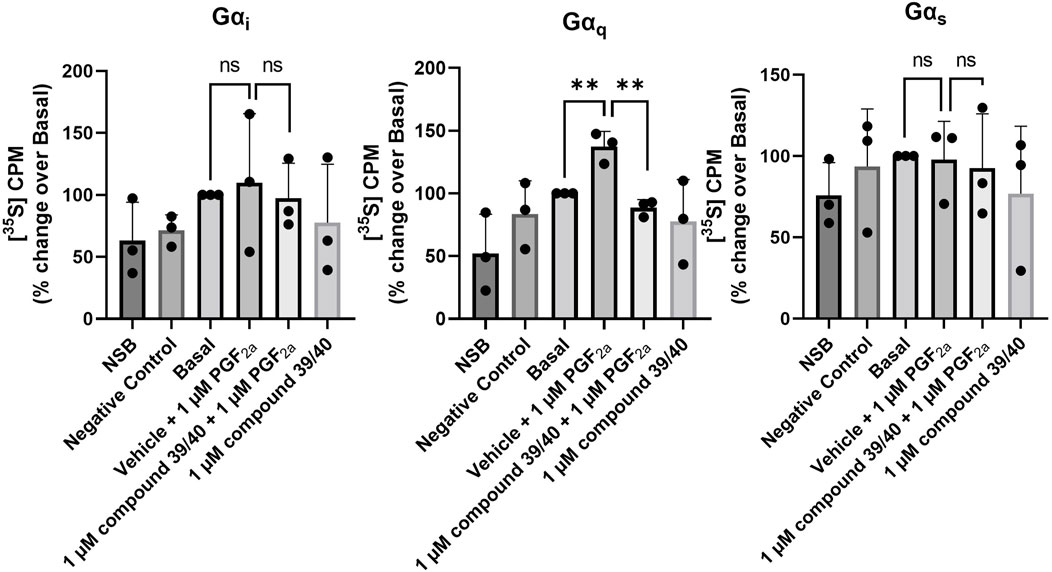
FIGURE 3. Immunoprecipitation of [35S]-GTPγS–bound Gα-protein subunits in MYLA cells. Membranes prepared from cultured MYLA cells, stimulated with PGF2α, and inhibited with compound 39/40 for 2 min in the presence of [35S]-GTPγS and GDP. Activated membranes were incubated with antisera targeting Gαq, Gαi, or Gαs G proteins with protein-G Sepharose beads. Non-specific binding (NSB) was determined by incubating with 10 µM unlabelled GTPγS, and a negative control was determined by incubating with isotype control antisera. Data are mean ± SD, N = 3 (data were analysed by one-tailed, unpaired t-tests comparing vehicle + 1 µM PGF2α to basal and vehicle + 1 µM PGF2α to 1 µM compound 39/40 + 1 µM PGF2α; ns, not significant; **p < 0.01).
The novel FP antagonist, N582707, is more potent than comparator FP antagonists
Using our MYLA cell line, we sought to assess the novel FP antagonist, N582707 (Figure 1), in comparison to four compounds from the literature (Table 1) on PGF2α-induced Ca2+ oscillations. MYLA cells were incubated with 1 µM PGF2α (to achieve ∼99% FP receptor occupancy and to reflect physiological concentrations) in the presence of 10 half-log incremental concentrations: 300 pM to 10 µM of FP antagonists. The results demonstrated that the FP antagonists inhibited PGF2α-stimulated Ca2+ release as determined by Fmax, AUC, and frequency (Figure 4; Table 3). Of the five tested FP antagonists, N582707 was the most potent for all tested criteria, with pIC50 values in a nanomolar range [Fmax 7.67 ± 0.63 (IC50 21.26 nM), AUC 7.30 ± 0.32 (IC50 50.43 nM) and frequency of Ca2+ oscillations 7.66 ± 0.41 (IC50 22.15 nM)].
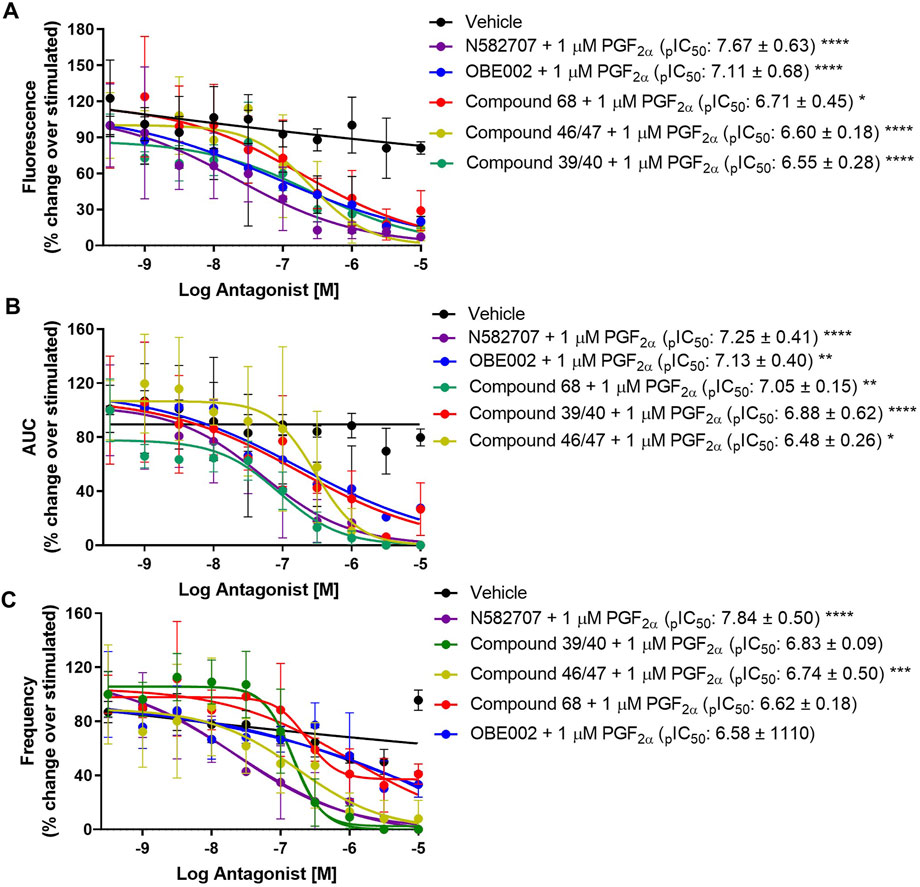
FIGURE 4. Effect of five FP antagonists upon PGF2α-stimulated Ca2+ transients in MYLA cells. FP antagonist + 1 µM PGF2α concentration–response curves. Data were analysed to assess (A) maximal fluorescence response, (B) the area under the curve (AUC), and (C) the frequency of Ca2+ oscillation during the 3 min of stimulation. Data was calculated as [(raw data − background) − minimum background]/averaged ionomycin Fmax and then percentage corrected to stimulated (1 µM PGF2α). Data are mean ± SD, N = 3. All IC50, pIC50, CI, and HillSlope values obtained are shown in Table 3. Data were analysed by two-way ANOVA and post hoc Dunnett’s multiple comparison test comparing FP antagonist treatment to vehicle, *p < 0.05, **p < 0.01, ***p < 0.001, and ****p < 0.0001.
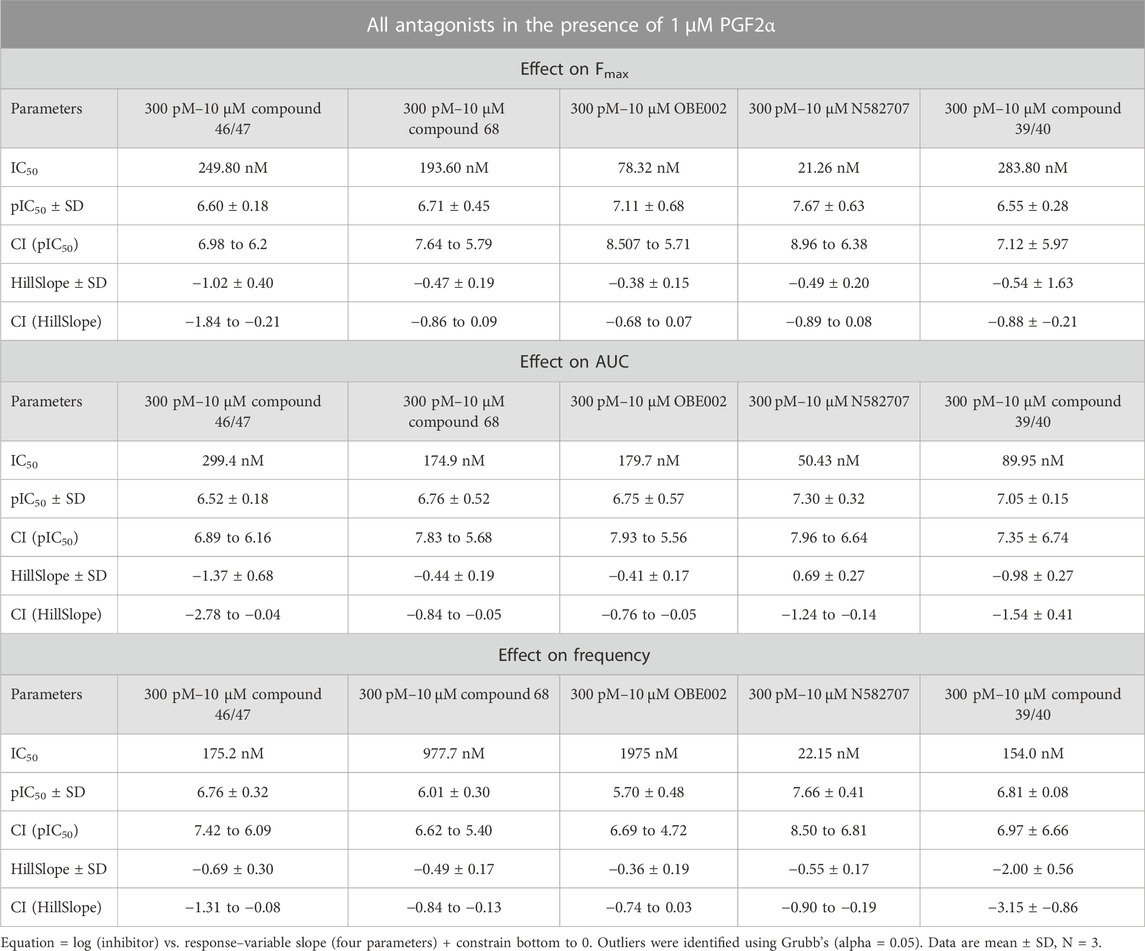
TABLE 3. Summary statistics for the effect of the five FP antagonists upon MYLA cells, as depicted in Figure 4.
PGF2α stimulates the development of a pro-labour phenotype and induces a phenotypical switch from a myofibroblastic to a smooth muscle phenotype in MYLA cells
It has previously been reported that PGF2α is not only involved in the contractile phase of labour but also in the activation of parturition (Xu et al., 2013; Xu et al., 2015). To assess if PGF2α stimulates the development of a pro-labour phenotype, MYLA cells were treated with either 1 µM PGF2α or ethanol vehicle control and then harvested at seven time points after treatment. Principal component analysis (PCA) plot PC1 (Figure 5A) demonstrates a difference in grouping by time, defined as ‘early’ (1 h, 3 h, 6 h, 9 h, and 12 h) or ‘late’ (12 h and 24 h). PC2 captures a difference in grouping by treatment (control vs. PGF2α). Together, PC1 and PC2 demonstrate that the data were clean and clustered well, describing 50% of transcriptomic variation. PCA plot PC3 (Figure 5B) captured a second grouping of mRNA changes by time, whereby ‘early’ (1 h and 3 h) and ‘late’ (24 h and 48 h) time points are grouped, and ‘mid’ (6 h, 9 h, and 12 h) time points are grouped. Differential gene expression analysis showed that with an increase in time, there was an increase in the number of differentially expressed genes (Figure 6).
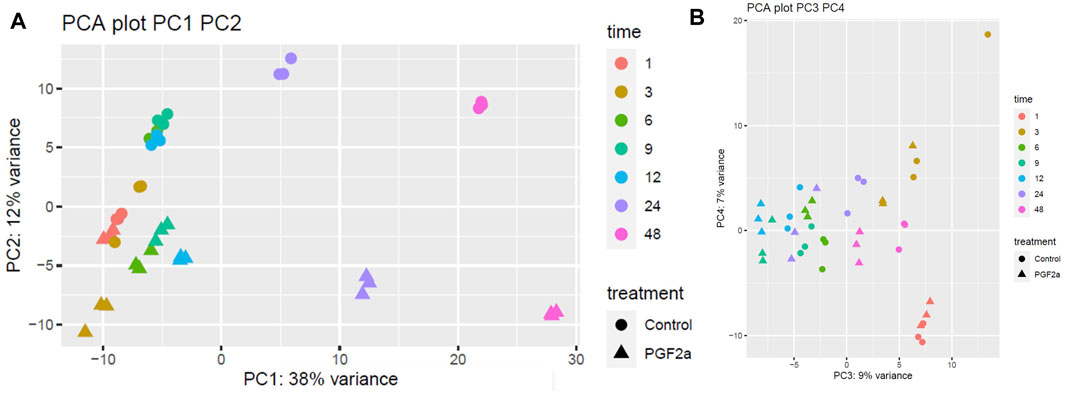
FIGURE 5. PCA plots of RNA-Seq data to capture the largest sources of variability in MYLA transcriptomes. RNA-Seq data was collected from MYLA cells treated with either 1 µM PGF2α or vehicle equivalent at time 0 followed by cells harvested at 1 h, 3 h, 6 h, 9 h, 12 h, 24 h, and 48 h. Colours indicate different time points, and shapes indicate different treatments; control (circles) or PGF2α (triangles). (A) Principal component analysis (PCA) plot PC1 captures a difference in grouping by time defined as ‘early’ (1 h, 3 h, 6 h, 9 h, and 12 h) or ‘late’ (24 h and 48 h). PC2 captures a difference in grouping by treatment (control vs. PGF2α). In total, PC1 and PC2 capture 50% of transcriptomic variation. (B) PCA plot PC3 captures a second grouping by time, whereby ‘early’ (1 h and 3 h) and ‘late’ (24 h and 48 h) time points are grouped, and ‘mid’ time points (6 h, 9 h, and 12 h) are grouped.
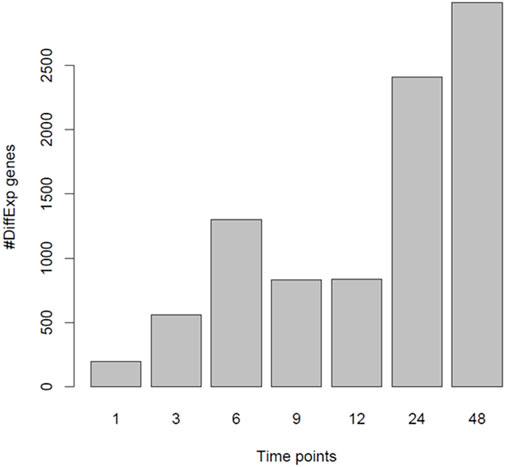
FIGURE 6. Number of differentially expressed genes when comparing PGF2α vs. control data. RNA-Seq data was collected from MYLA cells treated with either 1 µM PGF2α or vehicle equivalent at time 0 followed by harvesting cells at 1 h, 3 h, 6 h, 9 h, 12 h, 24 h, and 48 h. The number of differentially expressed genes increased with time in two phases, 1 h to 6 h and then from 24 h to 48 h.
To investigate further changes in the mRNA levels, we generated Z-scores of the transcripts per million (TPM) values for the >2,500 differentially expressed genes. A heat map of the top 25 most significant differentially expressed genes as compared to their 1-h time point is depicted in Figure 7. As suggested by the PCA, there was a clear separation between PGF2α treatment and vehicle control. Several key genes involved in labour, such as OXTR, were upregulated in the PGF2α treatment group as well as upregulated over time. Also prominent was an upregulation of pro-labour genes that are associated with leucocyte infiltration and inflammation such as IL6 and IL11. Conversely, several genes such as CXCL12, ALDH1A3, and CPA4 decreased in expression with time and treatment.
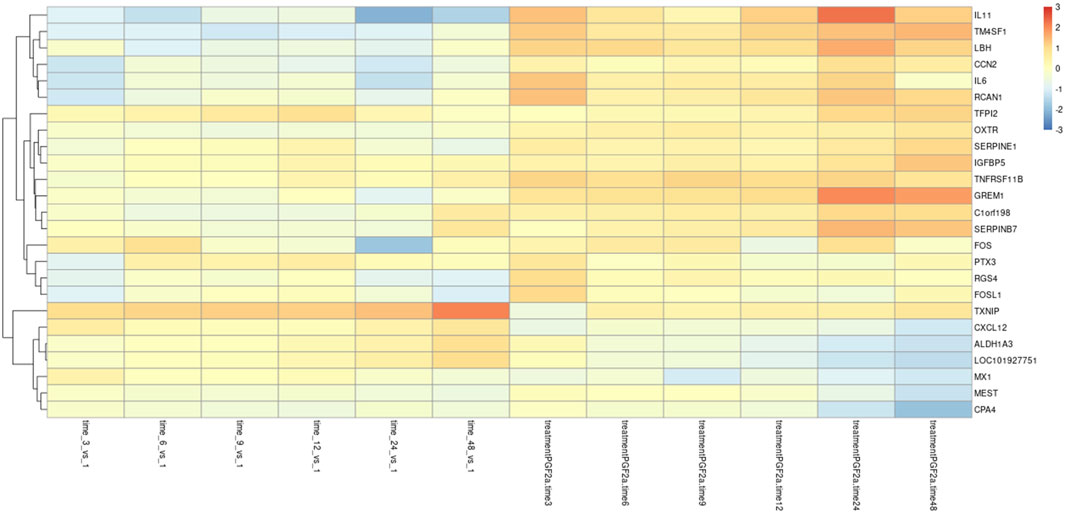
FIGURE 7. Differential gene expression in MYLA transcriptomes. RNA-Seq data was collected from MYLA cells treated with either 1 µM PGF2α or vehicle equivalent at time 0 followed by harvesting cells at 1 h, 3 h, 6 h, 9 h, 12 h, 24 h, and 48 h. Heatmap of the top 25 differentially expressed genes in the control and PGF2α-treated cells as compared to their 1 h time point, identified using DESeq2.
The RNA-Seq data were then cross-referenced with a publicly available data set (WikiPathways 2021 human) to determine the top 10 enrichment terms (Table 4). The most enriched term was ‘myometrial relaxation and contraction,’ suggesting that PGF2α alone was stimulating the development of genes associated with a pro-labour phenotype as well as a smooth muscle phenotype (e.g., CALD1 and ACTA2). The RNA-Seq data were then cross-referenced with the data set generated by Chan et al. (2014) that measured the transcriptome differences in human myometrial samples prior to and after the onset of spontaneous labour (Table 5). Comparatively, over time, the number of differentially expressed genes per time point in both data sets increased from 26 to 141 common genes and smooth muscle markers from 2 to 18 common genes, implicating again that PGF2α alone was stimulating not only a pro-labour phenotype but also the MYLA cells to differentiate into a smooth muscle phenotype.
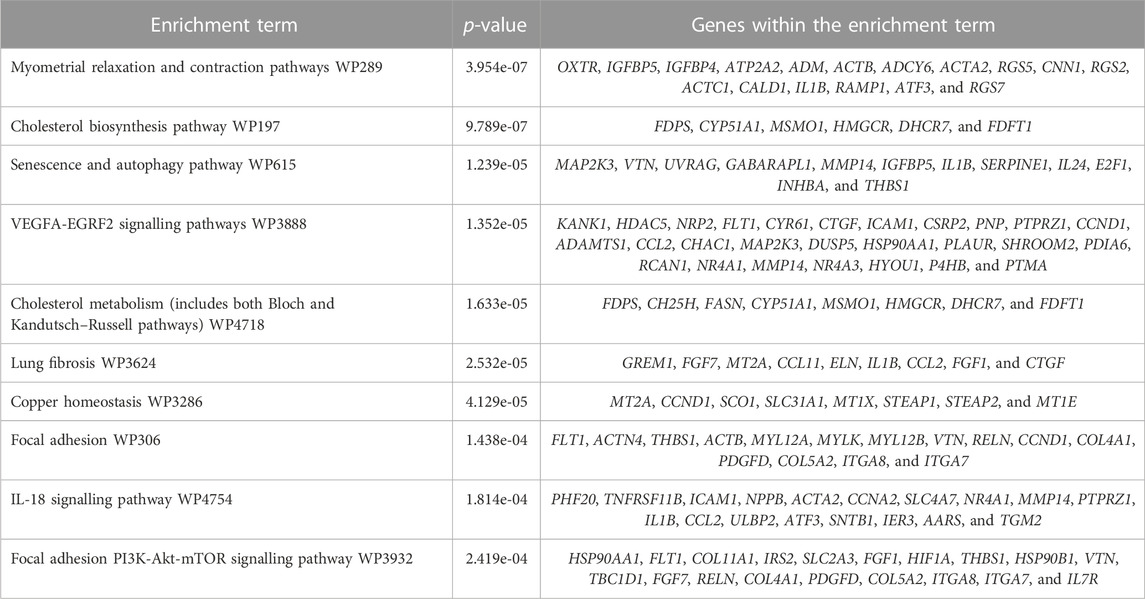
TABLE 4. Top 10 most significant enrichment terms and genes expressed within those terms as defined by WikiPathways 2021 human.
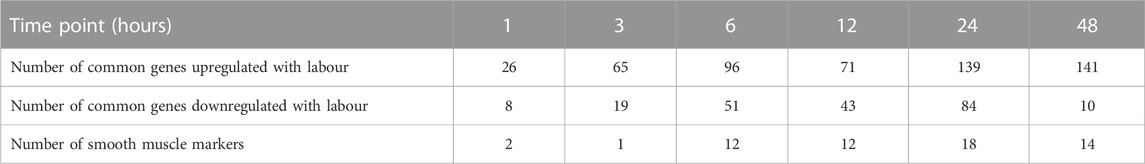
TABLE 5. Number of common differentially expressed genes per time point in our RNA-Seq data and the Chan et al. (2014) data set.
FP antagonism prevents PGF2α-stimulated activation of the myometrium
To determine that the development of a pro-labour phenotype and a smooth muscle phenotype is specifically FP receptor-mediated, additional time series data were conducted using MYLA cells treated with 1 µM PGF2α or 1 µM PGF2α + 1 µM N582707 or 1 µM PGF2α + 1 µM compound 39/40. Four fibroblast marker genes (DCN, LOXL1, FBLN1, and PDGFRA—Figure 8) and 10 smooth muscle marker genes (ACTA2, CNN1, COL4A1, COL4A2, MYOCD, TAGLN, TGFB2, TGFB3—Figure 9; CALD1 and MYLK—Figure 10) were analysed. The expression of all 10 smooth muscle markers was lower in both the control and FP antagonist–treated groups, while the expression of the four fibroblastic markers was higher in the control and FP antagonist–treated groups, as summarised in Figure 11. This indicates that PGF2α initiates a phenotypical switch in the MYLA cells, whereby they undergo differentiation from a myofibroblastic to a smooth muscle phenotype via FP receptor signalling.
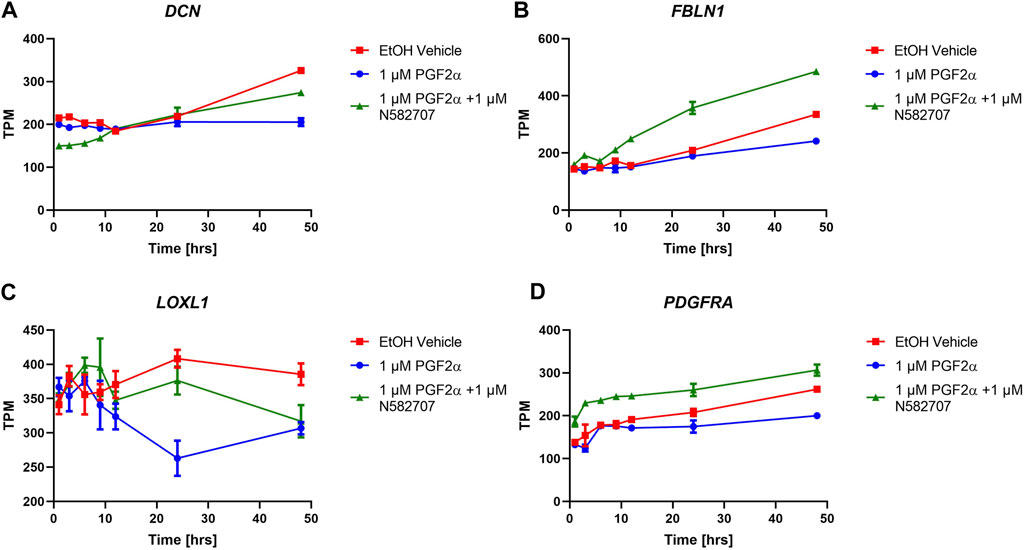
FIGURE 8. Temporal changes in selected fibroblast markers over a 48-h period in FP agonist and FP antagonist–treated MYLA cells. MYLA cells were stimulated for 1, 3, 6, 9, 12, 24, and 48 h with 1 µM PGF2α (blue), EtOH vehicle (red), or 1 µM PGF2α and 1 µM N582707 (green). (A) DCN (B) FBLN1, (C) LOXL1, and (D) PDGFRA. Expressions of the four fibroblast marker genes were analysed over time as determined by RNA-Seq and expressed as transcripts per million (TPM). Each time point was performed in triplicate and is represented as mean ± SD. Data were analysed by two-way ANOVA and Dunnett’s multiple comparison test comparing treatments to EtOH vehicle, *p < 0.05, **p < 0.01, and ****p < 0.0001.
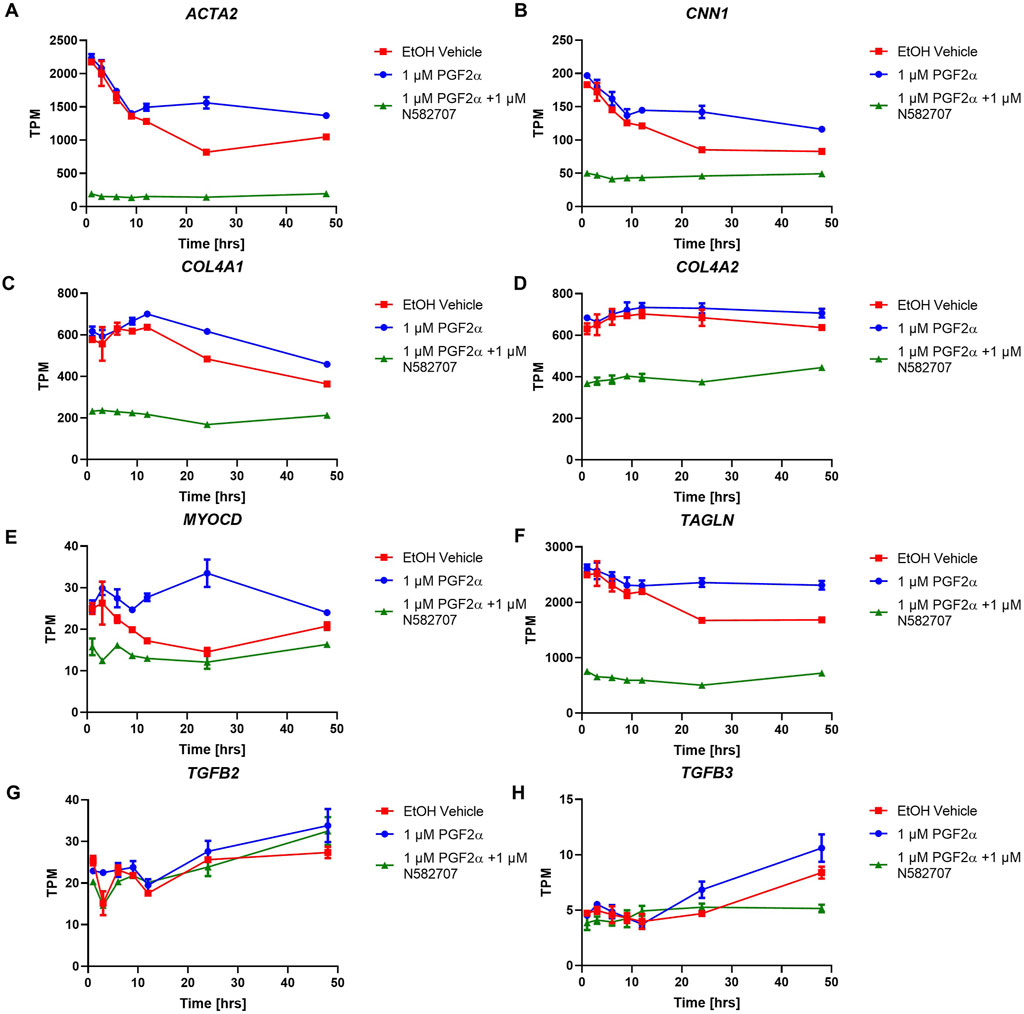
FIGURE 9. Temporal changes in selected smooth muscle markers over a 48-h period in FP agonist and FP antagonist–treated MYLA cells. MYLA cells were stimulated for 1, 3, 6, 9, 12, 24, and 48 h with 1 µM PGF2α (blue), EtOH vehicle (red), or 1 µM PGF2α and 1 µM N582707 (green). (A) ACTA2, (B) CNN1, (C) COL4A1, (D) COL4A2, (E) MYOCD, (F) TAGLN, (G) TGFB2, and (H) TGFB3. Expressions of the eight smooth muscle marker genes were analysed over time as determined by RNA-Seq and expressed as transcripts per million (TPM). Each time point was performed in triplicate and is represented mean ± SD. Data were analysed by two-way ANOVA and Dunnett’s multiple comparison test comparing treatments to EtOH vehicle, *p < 0.05, **p < 0.01, and ****p < 0.0001.
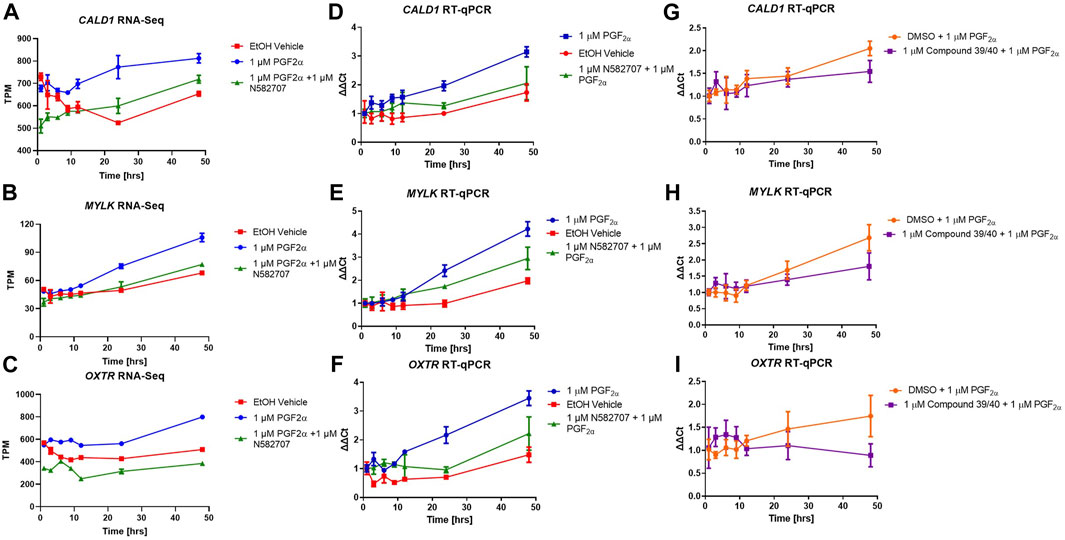
FIGURE 10. Transcriptional changes in FP agonist and FP antagonist–treated MYLA cells during a 48-h period as determined by RNA-Seq and RT-qPCR. MYLA cells were stimulated for 1, 3, 6, 9, 12, 24, and 48 h with 1 µM PGF2α (blue), EtOH vehicle (red), or 1 µM PGF2α and 1 µM N582707 (green). (A) CALD1 and (B) MYLK were used as representative smooth muscle cell markers, and (C) OXTR as a pro-labour marker. Expressions of the three genes were analysed over time as determined by RNA-Seq and expressed as transcripts per million (TPM). (D) CALD1, (E) MYLK, and (F) OXTR expressions over time as determined by RT-qPCR and expressed as fold change (ΔΔCt) using the geometric mean of RPL19, GAPDH, and ACTB housekeeping genes and as compared to equivalent 1 h time points. In a second time series, MYLA cells were stimulated for 1, 3, 6, 9, 12, 24, and 48 h with 1 µM DMSO + 1 µM PGF2α (orange) or 1 µM PGF2α and 1 µM compound 39/40 (purple). (G) CALD1, (H) MYLK, and (I) OXTR expressions over time as determined by RT-qPCR expressed as fold change (ΔΔCt) using the geometric mean of RPL19, GAPDH, and ACTB housekeeping genes and as compared to equivalent 1 h time points. Each time point was performed in triplicate and is represented as mean ± SD. Data were analysed by two-way ANOVA and Dunnett’s multiple comparison test comparing treatments to EtOH vehicle control, *p < 0.05, **p < 0.01, ***p < 0.001, and ****p < 0.0001.
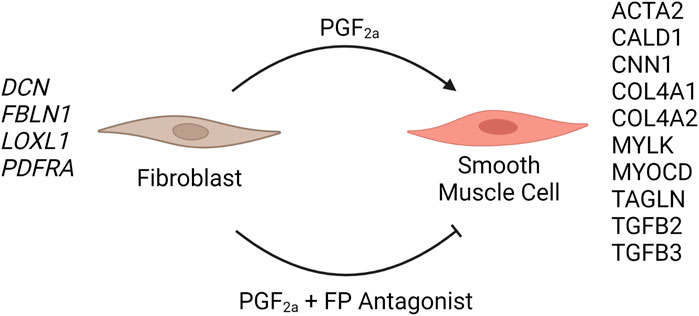
FIGURE 11. Schematic summary of the effect of PGF2a-treated or PGF2a + FP antagonist–treated MYLA cells. The addition of 1 µM PGF2α to MYLA cells stimulated increased expression of several smooth muscle marker genes, namely, ACTA2, CALD1, CNN1, COL4A1, COL4A2, MYLK, MYOCD, TAGLN, TGFB2, and TGGFB3. The addition of 1 µM PGF2α + 1 µM N582707 increased the expression of several fibroblast marker genes including DCN, FBLN1, LOXL1, and PDFRA.
The pro-labour gene, OXTR, and two smooth muscle markers, CALD1 and MYLK, were used to validate these results using RT-qPCR. This determined that both N582707 and compound 39/40 reduced the expression of OXTR, CALD1, and MYLK (Figure 10). When specifically looking at the difference between gene expression at 48 h, there was a significant decrease in OXTR, CALD1, and MYLK expression when treated with either N582707 or compound 39/40 (Figure 12). Overall, this demonstrates that PGF2α via the FP receptor could initiate activation of the myometrium prior to labour and implies a potential role for FP antagonism in the prophylactic management of PTB in addition to the known effects on uterine contractility.
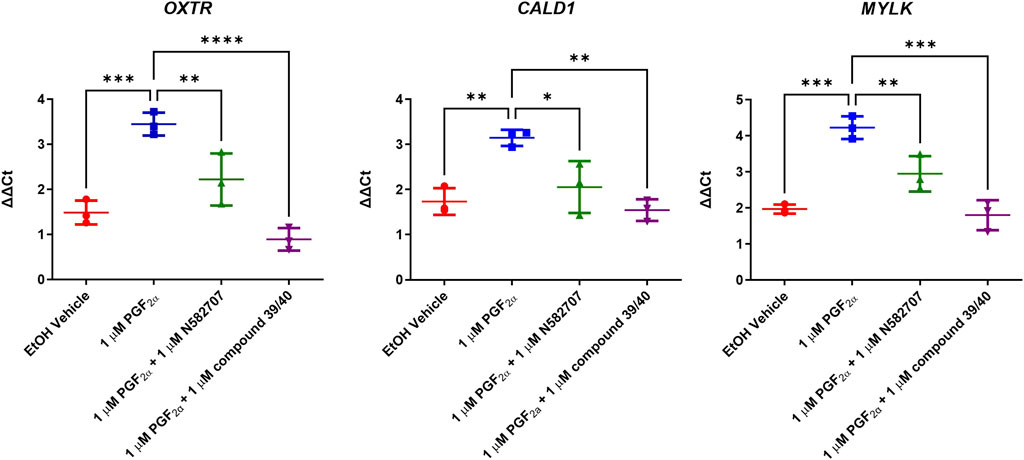
FIGURE 12. Expressions of OXTR, CALD1, and MYLK in MYLA immortalised myometrial cells after 48 h treatment with PGF2α or PGF2α + FP antagonist. Cells were stimulated for 48 h with vehicle, 1 µM PGF2α and 1 µM PGF2α + 1 µM N582707 or compound 39/40. CALD1 and MYLK were used as representative smooth muscle cell markers and OXTR due to their association with the progression of labour. Data are expressed as fold change (ΔΔCt). Data are mean ± SD, N = 3, one-way ANOVA and post hoc Dunnett’s multiple comparison test comparing conditions to 1 µM PGF2α, *p < 0.05, **p < 0.01, ***p < 0.001, and ****p < 0.0001.
Discussion
It is commonly accepted that PGF2α is involved in several events during human parturition, such as stimulating cervical ripening, rupturing the foetal membranes, and playing an important role during the final stages of parturition by regulating uterine contractility (Maclennan and Green, 1979; Casey and MacDonald, 1988; Senior et al., 1993; Lee et al., 2009). While evidence exists that PGF2α can upregulate the expression of uterine activation proteins, an in-depth analysis of the effect of PGF2α upon the myometrium is yet to be elucidated (Xu et al., 2013; Xu et al., 2015). Furthermore, the FP receptor is expressed in a limited number of human tissues (eye and myometrium) (Matsumoto et al., 1997; Mukhopadhyay et al., 2001) and is involved in pulmonary fibrosis (Oga et al., 2009). This makes the FP receptor an attractive target for the development of novel therapies for PTB.
This study was a first look at several comparator FP antagonists, of which only OBE002 has been investigated for the treatment of PTB, in comparison to a novel FP antagonist, N582707. We demonstrated that our MYLA cell line derived from myometrial tissue obtained from a pregnant, non-labouring woman was a suitable human myometrial model. Stimulation with PGF2α activated Gαq-specific G-protein coupling with no effect on non-FP receptor–specific Gαs and Gαi coupling in addition to a concentration-dependent increase in intracellular Ca2+. Both Gαq coupling and Ca2+ release were inhibited by FP antagonists, with the novel FP antagonist N582707 being the most potent when compared to several known FP antagonists. This highlighted the potential of N582707 to be used as a tocolytic treatment for PTB management.
Prior to the onset of labour, the myometrium must undergo a process of activation, whereby the muscle becomes more electrically excitable and susceptible to pro-contractile hormones (Blanks and Brosens, 2012). This is mediated by an increased expression of contraction-associated genes such as OXTR, PTGS2, and CX43 (Blanks and Brosens, 2012; Xu et al., 2013). Therefore, in addition to a tocolytic effect, we sought to determine if PGF2α could initiate activation of the myometrium and, furthermore, if treatment with N582707 could inhibit this activation. Using RNA sequencing, we determined that PGF2α stimulates a time-dependent phenotypic transformation of MYLA cells from a myofibroblast-like phenotype to a smooth muscle-like phenotype and increases the number of pro-labour genes. When cross-referencing our transcriptomics data to fresh human samples from term not in labour and spontaneous labour from data collected by Chan et al. (2014), we found a significant overlap in the mRNA signature seen in our PGF2α-stimulated MYLA time course. FP antagonism inhibited this phenotypical switch, supporting the hypothesis that PGF2α not only is important during labour to stimulate contractions but also plays a critical role in genetically transforming the myometrium from a quiescent to an activated state. Therefore, these data demonstrate that in addition to using FP antagonists as tocolytics, FP antagonism could be used prophylactically to prevent the maturation of the myometrial smooth muscle to a pro-labour phenotype.
While this time series provided insight into the changes elicited by PGF2α in MYLA cells, we did not include an analysis on the mRNA transcriptome in the presence of progesterone. In a study by Madsen et al. (2004), it was determined that prostaglandins such as PGF2α have the potential to induce functional progesterone withdrawal by modulating progesterone receptor isoform expression. Therefore, it would be beneficial to develop this labour model by the addition of other hormones such as progesterone to more closely simulate the changes that occur during pregnancy. Furthermore, in future studies, it will be important to demonstrate functional changes in the myometrial cell phenotype that are reversible with FP antagonism.
We hypothesise that in addition to the importance of PGF2α in the progression of labour, PGF2α may also be important in the activation of the myometrium by inducing a phenotypical switch in myometrial cells, causing the development of a smooth muscle phenotype and upregulating pro-labour genes. This suggests not only a therapeutic potential for FP receptor antagonists as a tocolytic treatment for PTB but also the potential of using FP antagonists prophylactically to prevent premature activation of the myometrium.
Materials and methods
Cell culture
Primary myometrial cells (MYLA) were established from a myometrial sample obtained with informed consent from a pregnant woman at 38 weeks gestation undergoing elective caesarean section for breech presentation at term not in labour. Following delivery of the baby and prior to delivery of the placenta, a full-thickness myometrial biopsy was taken, prior to Syntocinon bolus, from the upper lip of the lower uterine segment incision in the midline. The sample was placed in modified Krebs–Henseleit solution (mM): NaCl, 133; KCl, 4.7; glucose, 11.1; MgSO4, 1.2; KH2PO4, 1.2; CaCl, 2.5; 2-[[1,3-dihydroxy-2-(hydroxymethyl)propan-2-yl]amino]ethanesulfonic acid, 10; pH, 7.4). Primary myocytes were isolated by digestion in 2 mg/mL collagenase (Type IV, Fisher Scientific, Loughborough, United Kingdom) in Dulbecco’s modified Eagle’s medium for up to 1 h at 37°C. The cells were released by trituration through fire-polished glass pipettes. Freshly isolated myocytes were plated, prior to transformation and selection, in Dulbecco’s modified Eagle’s medium supplemented with 10% foetal calf serum, penicillin (100 IU/mL), and streptomycin (100 μg/mL).
Transformation: TEFLYA cells producing retroviruses either hTERT or a temperature-sensitive mutation of SV40 U19tsA58 Δ89-97 were cultured in DMEM supplemented with 10% FBS and antibiotics (penicillin/streptomycin plus 100 ug/mL hygromycin for TEFLYA hTERT and 1.5 mg/mL G418 for TEFLYA SV40 U19tsA58 Δ89-97) at 37°C and 5% CO2 (O'Hare et al., 2001). Virus-containing supernatants were harvested after growing near confluent cultures in a T75 flask for 12 h in a 10 mL growth medium without antibiotic selection. Supernatants from both virus-producing lines were filtered through a 0.45-µm filter and mixed 1:1, and this virus stock was used immediately for the transduction of primary cells.
The primary myometrial cells were cultured in Dulbecco’s modified Eagle medium (DMEM)/F12 supplemented with 10% foetal calf serum, penicillin (100 IU/mL), and streptomycin (100 μg/mL) in a T75 flask. For virus transduction, the medium was removed and replaced with 5 mL of virus stock plus 5 mL of fresh growth medium and 16 µL of 5 mg/mL polybrene (8 μg/mL final concentration). The medium was replaced the next day with 14 mL of fresh growth medium and allowed to grow for 3 days, passaging into a new flask as required. Four days after transduction, the cells were seeded at low density into 14-cm Petri dishes, and 0.25 μg/mL G418 and 30 μg/mL hygromycin B were added for selection of stable transformants. Three days after the start of the selection, the cells were cultured at a permissive temperature of 33°C to activate SV40 large T antigen. Individual colonies were picked using cloning discs and transferred into a 96-well plate after 2–4 weeks and expanded into 24-well and 6-well plates. Conditionally immortalised MYLA cells were maintained for rapid proliferation at 33°C and analysed at 37°C when the large T antigen was inactive. The cells were authenticated with ASN-002 short tandem repeat (STR) profiling by Eurofins Genomics Europe Applied Genomics GmbH (Supplementary Materials S3) to provide a reference for future maintenance of cell purity and genomic integrity. The cells were subcultured at 90% confluency by lifting with 0.05% trypsin and not used beyond passage 12.
Literature FP antagonists
Literature FP antagonists were synthesised using the described literature methodologies or purchased from a commercial supplier. N582707 was synthesised by Ferring Research Institute Inc. (San Diego, CA, United States) using the described methodologies. All compounds were solvated in DMSO to 10 mM and then diluted prior to use in biological assays. The chemical names and literature references (Martos et al., 2016; Pohl et al., 2018; Beck et al., 2020) are listed in Table 1.
Synthesis of novel FP antagonist N582707
A complete schema for the synthesis of N582707 is shown in Figure 1. All reactions were carried out in an oven-dried round-bottomed flask under an inert nitrogen atmosphere with stirring. Solvents, reagents, and chemicals were purchased from various sources and used as received unless otherwise noted. Spectra for 1H were recorded at room temperature with a Bruker PA BBO 400S1 BBF-H-D-05 Z SP (400 MHz) spectrometer or a Varian ASW probe (400 MHz) unless otherwise noted. Chemical shifts are reported in δ (ppm) relative units to residual solvent peaks CDCl3 (7.26 ppm for 1H) and DMSO-d6 (2.50 ppm for 1H and 39.5 ppm for 13C). Splitting patterns are assigned as s (singlet), d (doublet), t (triplet), multiplet (m), and dd (doublet of doublet). Mass spectrometry measurements were recorded using the Vanquish Horizon UHPLC System connected to Thermo Orbitrap Q Exactive Plus in high-resolution positive mode. The predicted masses were extracted to ±5 ppm.
Tetrahydrothiophen-3-ol (B): To a mixture of A (20 g, 195.78 mmol, 16.67 mL, 1 eq) in THF (200 mL) was added BH3-THF (1 M, 195.78 mL, 1 eq) in one portion at 0°C under N2. The mixture was stirred at 20°C for 12 h. TLC (petroleum ether:ethyl acetate = 3:1, Rf = 0.40) showed that the reaction was complete. The residue was poured into MeOH (10 mL) and stirred for 30 min. The aqueous phase was extracted with EtOAc (3 × 10 mL). The combined organic phase was washed with brine (3 × 10 mL), dried with Na2SO4, filtered, and concentrated under vacuum. The residue was purified by silica flash column chromatography to afford 18.0 g (88% yield) of B as a white solid.
Tetrahydrothiophen-3-yl methanesulfonate (C): To a mixture of B (18 g, 172.79 mmol, 1 eq) in DCM (200 mL) was added DMAP (31.67 g, 259.19 mmol, 1.5 eq) in one portion at 0°C under N2. Then, MsCl (23.75 g, 207.35 mmol, 16.05 mL, 1.2 eq) was added. The mixture was stirred at 20°C for 12 h. TLC (petroleum ether:ethyl acetate = 1:1, Rf = 0.45) showed that the reaction was complete. The residue was poured into water (10 mL) and stirred for 3 min. The aqueous phase was extracted with DCM (3 × 10 mL). The combined organic phase was washed with brine (10 mL × 3), dried with Na2SO4, filtered, and concentrated under vacuum. The residue was purified by silica flash column chromatography to afford 29.5 g (93.7% yield) of C as a white solid.
Tetrahydrothiophene-3-carbonitrile (D): To a mixture of C (29.5 g, 161.86 mmol, 1 eq) in DMF (300 mL) was added sodium cyanide (39.66 g, 809.28 mmol, 5 eq) in one portion at 70°C under N2. The mixture was stirred at 70°C for 12 h. TLC (petroleum ether:ethyl acetate = 5:1, Rf = 0.35) showed that the reaction was complete. The residue was poured into water (10 mL) and stirred for 3 min. The aqueous phase was extracted with MTBE (3 × 20 mL). The combined organic phase was washed with brine (3 × 20 mL), dried with Na2SO4, filtered, and concentrated under vacuum. The residue was purified by silica flash column chromatography to afford 10.8 g (59% yield) of D as a white solid.
N-methoxy-N-methyltetrahydrothiophene-3-carboxamide (E): A solution of D (5.25 g, 46.39 mmol, 1 eq) in EtOH (10 mL) was added to a solution of NaOH (19.30 g, 482.42 mmol, 10.4 eq) in H2O (223.1 mL) and EtOH (112.9 mL). The mixture was stirred at 100°C for 3 h. TLC (petroleum ether: ethyl acetate = 5:1, Rf = 0) showed that the reaction was complete. The reaction was quenched with 1 M of hydrochloric acid to adjust pH to 3. The mixture was concentrated under vacuum. The mixture was dissolved in DCM (20 mL), dried with MgSO4, filtered, and concentrated under vacuum. The crude compound was used as is for the next step.
The crude compound and N-methoxymethanamine (4.53 g, 46.39 mmol, 1 eq) in DCM (60 mL) was added 50% T3P (35.42 g, 55.67 mmol, 33.1 mL, 1.2 eq) and TEA (14.1 g, 139.2 mmol, 19.37 mL, 3 eq) in one portion at 20°C under N2. The mixture was stirred at 20°C for 12 h. TLC (DCM: MeOH = 15:1, Rf = 0.7) showed that the reaction was complete. The residue was poured into water (10 mL) and stirred for 3 min. The aqueous phase was extracted with DCM (3 × 10 mL). The combined organic phase was washed with brine (3 × 10 mL), dried with Na2SO4, filtered, and concentrated under vacuum. The residue was purified by flash column chromatography (SiO2, DCM:MeOH = 15:1, Rf = 0.7) to afford 6.89 g (85% yield, two steps) of E as a white solid.
(4-Fluorophenyl)(tetrahydrothiophen-3-yl)methanone (F): To a mixture of E (6.89 g, 39.32 mmol, 1 eq) in THF (150 mL) was added (4-fluorophenyl)magnesium bromide (1 M, 157.26 mL, 4 eq) in one portion at 0°C under N2. The mixture was stirred at 0°C for 1 h. TLC (petroleum ether:ethyl acetate = 5:1, Rf = 0.52) showed that the reaction was complete. The residue was poured into NH4Cl (10 mL). The mixture was extracted with ethyl acetate (2 × 10 mL). The organic phase was washed with brine (10 mL), dried with Na2SO4, filtered, and concentrated under vacuum. The residue was purified by flash column chromatography (SiO2, petroleum ether:ethyl acetate = 5:1, Rf = 0.52) to afford 8.25 g (99.8% yield) of F as a white solid.
(1,1-Dioxidotetrahydrothiophen-3-yl)(4-fluorophenyl)methanone (G): To a mixture of F (10 g, 47.56 mmol, 1 eq) in DCM (50 mL) was added 80% m-CPBA (30.78 g, 142.68 mmol, 3 eq) in one portion at 0°C under N2. The mixture was stirred at 0°C for 1 h. TLC (petroleum ether: ethyl acetate = 1:1, Rf = 0.43) showed that the reaction was complete. The residue was poured into Na2SO3 (100 mL) and stirred for 3 min. The aqueous phase was extracted with DCM (20 mL). The combined organic phase was washed with saturated NaHCO3 (30 mL) and washed with brine, dried with Na2SO4, filtered, and concentrated under vacuum. The residue was purified by flash column chromatography (petroleum ether/ethyl acetate = 5/1 to 1/1) to afford 7.29 g (73% yield) of G as a white solid.
(E)-3-((4-fluorophenyl)(hydroxyimino)methyl)tetrahydrothiophene 1,1-dioxide (H): To a mixture of G (2.1 g, 8.67 mmol, 1 eq) in MeOH (83 mL) was added NaOAc (10.38 g, 126.56 mmol, 14.6 eq) and NH2OH∙HCl (1.20 g, 17.34 mmol, 2 eq) in one portion at 20°C under N2. The mixture was stirred for 12 h. TLC (petroleum ether:ethyl acetate = 1:1, Rf = 0.43) showed that the reaction was complete. The mixture was concentrated in vacuum. The residue was poured into water (50 mL) and stirred for 3 min. The aqueous phase was extracted with ethyl acetate (3 × 50 mL). The combined organic phase was washed with brine (3 × 50 mL), dried with anhydrous Na2SO4, filtered, and concentrated under vacuum. The residue was purified by flash column chromatography (SiO2, petroleum ether/ethyl acetate = 5/1 to 1/1) to afford 2.21 g of H as a white solid.
(2S)-N-((1,1-dioxidotetrahydrothiophen-3-yl)(4-fluorophenyl)methyl)-1-((4-(pyridin-3-yl)phenyl)sulfonyl)azetidine-2-carboxamide (I): Intermediate H (4.4 g, 17.10 mmol, 1 eq) was dissolved in MeOH (480 mL) and NH3∙H2O (80 mL). Pd/C (4.4 g, 8.16 mmol, 10% purity) was added in one portion at 50°C. The suspension was degassed under vacuum and purged with H2 several times. The mixture was stirred under H2 (50 psi) at 50°C for 12 h. TLC (petroleum ether:ethyl acetate = 1:1, Rf = 0) indicated that H was consumed completely. The mixture was filtered under Celite and concentrated under vacuum.
To a solution of (S)-1-((4-(pyridin-3-yl)phenyl)sulfonyl)azetidine-2-carboxylic acid (5.44 g, 17.10 mmol, 1 eq) in DCM (35 mL), HOBt (3.47 g, 25.65 mmol, 1.5 eq), EDCI (4.90 g, 25.65 mmol, 1.5 eq), and TEA (7.14 mL, 51.3 mmol, 3 eq) were added. The mixture was stirred at room temperature for 30 min and then added to the abovementioned crude mixture. The mixture was stirred at room temperature for 12 h. TLC (DCM:MeOH = 15:1, Rf = 0.33) indicated that the reaction was complete. The reaction mixture was quenched by the addition of H2O (30 mL). The residue was extracted with DCM (3 × 50 mL). The combined organic layers were washed with brine (2 × 20 mL), dried over Na2SO4, filtered, and concentrated under vacuum. The residue was purified by flash column chromatography (SiO2, petroleum ether/ethyl acetate = 1/1 to 0/1) to afford 6.35 g (68.3% yield, two steps) of I as a white solid.
N582707: Stereoisomeric mixture I was subjected to preparative SFC separation using a Cellulose-2 column from Phenomenex, Torrance, CA, USA (250 mm × 30 mm, 10 um) and [0.1% NH3H2O ETOH]; B%: 55%–55%, min, as the mobile phase. Four initial peaks were observed (P1–P4), with peak 1 (P1) being the eutomer. Isolation of P1 yielded 1.29 g (20.3% yield) of FE-0208599. 1H NMR (400 MHz, DMSO-d6) δ ppm 9.01 (s, 1H) 8.78 (d, J = 8.82 Hz, 1H) 8.67 (d, J = 4.85 Hz, 1H) 8.21 (br d, J = 7.94 Hz, 1H) 8.06 (d, J = 8.38 Hz, 2H) 7.93–8.00 (m, 2H) 7.57 (dd, J = 7.83, 4.74 Hz, 1H) 7.44 (dd, J = 8.38, 5.51 Hz, 2H) 7.19 (t, J = 8.82 Hz, 2H) 4.93 (br t, J = 8.82 Hz, 1H) 4.32 (t, J = 8.16 Hz, 1H) 3.71–3.81 (m, 1H) 3.61 (q, J = 8.01 Hz, 1H) 3.31–3.33 (m, 1H) 3.16–3.27 (m, 1H) 2.98–3.11 (m, 1H) 2.84–2.93 (m, 2H) 2.05–2.25 (m, 2H) 1.77–1.90 (m, 1H) 1.69 (br d, J = 5.07 Hz, 1H). 13C NMR (151 MHz, DMSO) δ 168.00, 162.23, 160.62, 147.16, 145.79, 140.98, 137.55, 136.45, 134.82, 134.33, 129.28, 129.02, 128.13, 125.04, 115.27, 115.12, 62.24, 55.38, 54.20, 51.65, 48.29, 41.12, 25.77, 19.18. Expected [M + H] C26H27FN3O5S2 = 544.1372; found [M + H] = 544.1366. All structural analysis data of N582707 can be found in Supplementary Materials S4–S8.
Agonist and antagonist Ca2+ assay
MYLA cells were grown to 95%–100% confluency in 3 cm2 glass-bottom dishes (MatTek Corporation, MA, United States). The cells were serum starved for 24–48 h with 2% DMEM/F12 media and then incubated with 5 μM CalbryteTM 520 AM (Stratech Scientific Ltd., Ely, United Kingdom) for 60 min at 37°C in a 95%/5% air/CO2-humidified environment, followed by 15 min at room temperature in the dark. The cells were washed and incubated in 2 mL modified Krebs–Henseleit (m-KHB) solution (composition (mM): NaCl, 133; KCl, 4.7; glucose, 11.1; MgSO4, 1.2; KH2PO4, 1.2; N-Tris (hydroxymethyl)methyl-2-aminoethanesulfonic acid, 10; CaCl2∙2H2O, 2.5; pH 7.4). The plates were then loaded on the stage of an Olympus IX81 inverted microscope and visualised with a 10x objective lens. Temperatures were maintained at 37°C. CalbryteTM 520 AM was excited at Ex/Em: 490/525 nm. The cells were imaged for 3 min to allow any initial LED-induced Ca2+ signalling to subside. For live experiments, cells were challenged for 3 min with a half-log incremental concentration of PGF2α or FP antagonist (300 p.m.–10 µM) in the presence of 1 µM PGF2α. Fluorescence was captured at a rate of one frame per second for 3 min, with agonist/antagonist injections occurring after a 30-s basal period. Then, 1 μM PGF2α or 100 nM oxytocin was added as a positive control, and 10 µM ionomycin (Sigma Aldrich, Poole, United Kingdom) provided a GPCR-independent positive control of Ca2+ release and determined the Fmax for analysis calculations.
Data analysis: Videos were visualised, and data were analysed using ImageJ, the image analysis software. Changes in fluorescence and area under the curve (AUC) of Ca2+ oscillations were calculated using the equation: ((raw data − background) − minimum background)/averaged ionomycin Fmax, and then percentage-corrected to stimulated (1 µM PGF2α). The frequency of Ca2+ oscillations was calculated as the average number of oscillations over time in seconds (Hz). All data were visualised using the GraphPad Prism 9 software.
[35S]-guanosine 5′-O-[gamma-thio] triphosphate binding
Tissue preparation: MYLA cells were grown to 95%–100% confluency in a T175 flask, lifted, and pelleted via standard cell culture techniques. The harvested cells were homogenised in ice-cold lysis buffer (composition (mM): HEPES, 20; EDTA, 1; MgCl2, 2; KCl, 10; DTT, 2; pH, 7.4) using a Coleman handheld homogeniser. The homogenates were cleared (1,000×g, 10 min, 4°C) and membranes were collected by centrifugation (16,100×g, 90 min, 4°C). The membranes were resuspended in freezing buffer [composition (mM): HEPES, 10; MgCl2, 1; DTT, 1; pH, 7.4], where the protein concentration was adjusted to 1.5 mg/mL and rapidly frozen in liquid nitrogen. The membranes were stored at −80°C until required.
Radioligand binding assay: 75 μg of membrane was added to 50 μL of assay buffer [composition (mM): HEPES, 10; MgCl2, 10; NaCl, 100; pH, 7.4] containing 1 nM [35S]-GTPγS (1,250 Ci/mmol) and 10 μM GDP, with or without agonist and antagonists as required, and incubated at 30°C for 2 min. Non-specific binding (NSB) was determined by the inclusion of 10 μM unlabelled GTPγS. Incubation was terminated by the addition of 900 μL of ice-cold assay buffer, and the samples were transferred to ice. The cell membrane was recovered from the reaction mixture by centrifugation (16,100×g, 6 min, 4°C), and the supernatant was removed by aspiration. Membrane pellets were solubilised by the addition of 50 μL of ice-cold solubilisation buffer [composition (mM): Tris-HCl, 100; NaCl, 200; EDTA, 1; IGEPAL CA 630, 1.25% (v/v); 0.2% (w/v) SDS; pH, 7.4] and vortex mixing. Once the protein was completely solubilised, an equal volume of solubilisation buffer without SDS was added. The solubilised protein was pre-cleared with rabbit serum (1:100 dilution) and 30 μL of Protein-G Sepharose beads (Invitrogen, Paisley, United Kingdom) (protein-G Sepharose bead suspension 30% v/v in TE buffer [composition (mM): Tris-HCl, 10; EDTA, 10; pH, 8.0)] for 60 min at 4°C. The Protein-G Sepharose beads and any insoluble material were collected by centrifugation (16,100×g, 6 min, 4°C), and then 100 μL of the supernatant was transferred to a fresh tube containing G-protein–specific antiserum (1:100 dilution of anti-Gαq/11/14 antibody (G-7), anti-Gαi-1 antibody (R4), or anti-Gαs/olf antibody (A-5); Santa Cruz Biotechnology, Inc., Heidelberg, Germany). The samples were vortex mixed and rotated overnight at 4°C. Then, 70 μL of 30% Protein-G Sepharose beads were added to each sample tube and vortex mixed before incubation for 90 min at 4°C. The protein-G Sepharose beads were pelleted (16,100×g, 6 min, 4°C) and the supernatant was removed. The beads were washed and pelleted thrice with 500 μL of solubilisation buffer (less SDS) before re-suspension in Pico-FlourTM scintillation cocktail (Perkin Elmer, Buckinghamshire, United Kingdom) where [35S]-GTPγS was determined by standard liquid scintillation counting methods.
Data analysis: Specific binding was determined by CPM values and expressed as a % increase over basal (unstimulated), and plotted using the GraphPad Prism 9 software.
RNA extraction and purity assessment
The MYLA cells were seeded into a T75 flask and allowed to grow to 95%–100% confluency. The cells were serum starved for 24 h and then treated with either 1 µM PGF2α, PGF2α vehicle (ethanol) equivalent or 1 µM PGF2α + 1 µM FP antagonist at time (T) 0. The cells were harvested at T = 1, 3, 6, 9, 12, 24, and 48 h, pelleted (1,200 rpm, 5 min, 4°C), and snap frozen on dry ice before storage at −80°C.
RNA was extracted from pelleted cells using the GenEluteTM Total RNA Purification Kit (Sigma Aldrich, Poole, United Kingdom) according to the manufacturer’s instructions. RNA concentration and purity were determined using a NanoDrop 1000 Spectrophotometer (Thermo Fisher Scientific, Loughborough, United Kingdom). All RNA samples were stored at −80°C until use.
cDNA generation and RT-qPCR
cDNA was generated using the VILO cDNA Synthesis Kit (Invitrogen, Paisley, United Kingdom) according to the manufacturer’s instructions and using the VeritiTM 96-Well Fast Thermal Cycler (Thermo Fisher, Loughborough, United Kingdom).
RT-qPCR samples were technical triplicates of biological triplicates in 364-well optical plates. Amplification was performed in 10 μL reactions containing 5 μL of 2X EXPRESS qPCR SuperMix with premixed ROX reference dye (Thermo Fisher, Loughborough, United Kingdom), 0.5 μL of each specific TaqMan primer pair-probe (listed in Supplementary Materials S9), and 1 μL of cDNA or water control. qRT-PCR was performed using the Applied Biosystems QuantStudio 5 Real-Time PCR System (qPCR) with an initial denaturation for 10 min at 95 °C, primer annealing at 50 °C for 2 min, followed by 40 cycles of 15 s at 95 °C and 1 min at 60 °C.
Data analysis: The relative expression of the target genes was calculated using the delta-CT method as described by Pfaffl (2001), normalised to the geometric mean of three housekeeping genes (GAPDH, ACTB, and RPL19), and then plotted using the GraphPad Prism 9 software.
RNA quality assessment, library preparation, and sequencing
RNA quality was verified using a Bioanalyzer according to the manufacturer’s instructions (Eukaryote Total RNA Nano, Agilent). Illumina TruSeq RNA libraries were prepared and sequenced using a NextSeq 500 with a high-output 75 bp cycle cartridge (Illumina, Cambridge, United Kingdom) by the University of Warwick Genomic Facility.
RNA-sequencing bioinformatics analysis
bcl2fastq v2.20.0.422 was used for demultiplexing each sample. FastQC v0.11.9 was used to quality control check the demultiplexed FastQC files, and MultiQC v1.9 consolidated the QC reports. Reads were aligned to the human reference genome build GRCh38 release 86 using STAR version 2.7.9a. The number of reads mapped to each genomic feature was calculated with featureCounts v2.0.1. The counts were imported into R Studio and analysed with the DESeq2 package.
Data analysis: TPM data were processed and analysed using R Studio and then plotted using the GraphPad 9 software.
Statistical analysis
Agonist and antagonist Ca2+ assay
Experiments were repeated on MYLA cells, where N represents the number of biological repeats. As provided in Figure 2 and Supplementary Materials S2, the data were analysed by one-way ANOVA with post hoc Dunnett’s multiple comparison test comparing agonist treatment to basal or antagonist treatment to 1 µM PGF2α-stimulated cells. The data calculated as p < 0.05 were considered statistically significant and are graphically represented as ****p < 0.0001, ***p < 0.001, **p < 0.01, and *p < 0.05. In Figure 4, data were analysed by two-way ANOVA with post hoc Dunnett’s multiple comparison test comparing antagonist treatment to vehicle-stimulated cells. Data calculated as p < 0.05 were considered statistically significant and are represented as ****p < 0.0001, ***p < 0.001, **p < 0.01, and *p < 0.05. As provided in Table 2 and Table 3, EC50, pEC50, IC50, pIC50, Emax, and Hill slope values were determined by removing outliers using Grubb’s (alpha = 0.05) and then plotted using [log (agonist/inhibitor) vs. response–variable response (four parameters)] and constraining the bottom to 0 using the GraphPad Prism 9 software.
[35S]-guanosine 5′-O-[gamma-thio] triphosphate binding
The experiments were repeated on MYLA cell membranes, where N represents the number of biological repeats. The data in Figure 3 were analysed by one-tailed, unpaired t-tests comparing vehicle + 1 µM PGF2α to basal and vehicle + 1 µM PGF2α to 1 µM compound 39/40 + 1 µM PGF2α. Data calculated as p < 0.05 were considered significant and are graphically represented as **p < 0.01. Not significant results are depicted as ns.
RNA sequencing
The experiments were technical triplicates of biological triplicate samples taken from seven time points. The data in Figures 8–10 were analysed by two-way ANOVA and post hoc Dunnett’s multiple comparison test comparing treatments to the ethanol vehicle. Data calculated as p < 0.05 were considered statistically significant and are graphically represented as ****p < 0.0001, ***p < 0.001, **p < 0.01, and *p < 0.05.
RT-qPCR
The experiments were technical triplicates of biological triplicate samples taken from seven time points. The data in Figure 12 were analysed by one-way ANOVA and post hoc Dunnett’s multiple comparison test comparing treatments to 1 µM PGF2α. Data calculated as p < 0.05 were considered statistically significant and are graphically represented as ****p < 0.0001, ***p < 0.001, **p < 0.01, and *p < 0.05.
Data availability statement
The data presented in the study are deposited in the Gene Expression Omnibus repository, accession number GSE249529.
Ethics statement
The studies involving humans were approved by Tommy’s National Reproductive Biobank REC: 18/WA/0356. The studies were conducted in accordance with the local legislation and institutional requirements. The participants provided their written informed consent to participate in this study.
Author contributions
IH: Data curation, formal analysis, investigation, methodology, validation, visualization, writing–original draft, review, and editing. AS: Methodology, resources, writing–review and editing. RS: Data curation, formal analysis, writing–review and editing. LB: Data curation, formal analysis, writing–review and editing. MA: Data curation, formal analysis, writing–review and editing. WW: Methodology, resources, writing–review and editing. JY: Formal analysis, methodology, resources, writing–review and editing. YY: Formal analysis, methodology, resources, writing–review and editing. PP: Resources, writing–review and editing. AS: Methodology, resources, writing–review and editing. GF: Conceptualization, investigation, methodology, project administration, resources, supervision, writing–review and editing. AB: Conceptualization, data curation, formal analysis, funding acquisition, investigation, project administration, supervision, writing–original draft, review, and editing.
Funding
The authors declare financial support was received for the research, authorship, and/or publication of this article. This work was funded by a project grant awarded to AB from Ferring Research Institute Inc. (San Diego, CA, United States). GF co-conceived the project. AS was supported by the Wellcome Trust Investigator Award (200870/Z/16/Z).
Acknowledgments
The authors are grateful to the women and couples who consented to this research and are indebted to all the staff in the Centre for Reproductive Medicine and Biomedical Research Unit, University Hospitals Coventry, and Warwickshire National Health Service Trust for facilitating myometrial sample collection. The authors thank Parmjit S. Jat (University College London) for providing stable retroviral producer cells for immortalisation. The authors are indebted to the staff at the Genomics Facility at the University of Warwick for running the next-generation sequencing and to Ayan Dirir, Paul J. Brighton, and Emma S. Lucas for technical assistance with the research.
Conflict of interest
Authors WW, JY, YY, PP, AS, and GF were employed by Ferring Research Institute Inc.
The remaining authors declare that the research was conducted in the absence of any commercial or financial relationships that could be construed as a potential conflict of interest.
Publisher’s note
All claims expressed in this article are solely those of the authors and do not necessarily represent those of their affiliated organizations, or those of the publisher, editors, and reviewers. Any product that may be evaluated in this article, or claim that may be made by its manufacturer, is not guaranteed or endorsed by the publisher.
Supplementary material
The Supplementary Material for this article can be found online at: https://www.frontiersin.org/articles/10.3389/fphar.2023.1285779/full#supplementary-material
References
Abramovitz, M., Adam, M., Boie, Y., Carrière, M.-C., Denis, D., Godbout, C., et al. (2000). The utilization of recombinant prostanoid receptors to determine the affinities and selectivities of prostaglandins and related analogs. Biochimica Biophysica Acta (BBA)-Molecular Cell Biol. Lipids 1483, 285–293. doi:10.1016/s1388-1981(99)00164-x
Beck, H., Thaler, T., Meibom, D., Meininghaus, M., Jorisse, H., Dietz, L., et al. (2020). Potent and selective human prostaglandin F (FP) receptor antagonist (BAY-6672) for the treatment of idiopathic pulmonary fibrosis (IPF). J. Med. Chem. 63, 11639–11662. doi:10.1021/acs.jmedchem.0c00834
Berridge, M. J., Bootman, M. D., and Roderick, H. L. (2003). Calcium signalling: dynamics, homeostasis and remodelling. Nat. Rev. Mol. Cell Biol. 4, 517–529. doi:10.1038/nrm1155
Blanks, A., and Brosens, J. (2012). Progesterone action in the myometrium and decidua in preterm birth. Facts, views Vis. ObGyn 4, 33–43.
Brodt-Eppley, J., and Myatt, L. (1998). Changes in expression of contractile FP and relaxatory EP2 receptors in pregnant rat myometrium during late gestation, at labor, and postpartum. Biol. reproduction 59, 878–883. doi:10.1095/biolreprod59.4.878
Brodt-Eppley, J., and Myatt, L. (1999). Prostaglandin receptors in lower segment myometrium during gestation and labor. Obstetrics Gynecol. 93, 89–93. doi:10.1016/s0029-7844(98)00378-0
Casey, M. L., and Macdonald, P. C. (1988). Biomolecular processes in the initiation of parturition: decidual activation. Clin. Obstetrics Gynecol. 31, 533–552. doi:10.1097/00003081-198809000-00005
Chan, Y. W., Van Den Berg, H. A., Moore, J. D., Quenby, S., and Blanks, A. M. (2014). Assessment of myometrial transcriptome changes associated with spontaneous human labour by high-throughput RNA-seq. Exp. Physiol. 99, 510–524. doi:10.1113/expphysiol.2013.072868
Chawanpaiboon, S., Vogel, J. P., Moller, A.-B., Lumbiganon, P., Petzold, M., Hogan, D., et al. (2019). Global, regional, and national estimates of levels of preterm birth in 2014: a systematic review and modelling analysis. Lancet Glob. Health 7, e37–e46. doi:10.1016/S2214-109X(18)30451-0
Csapo, A., and Pinto-Dantas, C. (1965). The effect of progesterone on the human uterus. Proc. Natl. Acad. Sci. 54, 1069–1076. doi:10.1073/pnas.54.4.1069
Davis, J. S., Weakland, L. L., Weiland, D. A., Farese, R. V., and West, L. A. (1987). Prostaglandin F2 alpha stimulates phosphatidylinositol 4, 5-bisphosphate hydrolysis and mobilizes intracellular Ca2+ in bovine luteal cells. Proc. Natl. Acad. Sci. 84, 3728–3732. doi:10.1073/pnas.84.11.3728
Engstrøm, T., Bratholm, P., Christensen, N. J., and Vilhardt, H. (2000). Effect of oxytocin receptor blockade on rat myometrial responsiveness to prostaglandin f(2)(alpha). Biol. reproduction 63, 1443–1449. doi:10.1095/biolreprod63.5.1443
Gibb, W. (1998). The role of prostaglandins in human parturition. Ann. Med. 30, 235–241. doi:10.3109/07853899809005850
Goldenberg, R. L., Culhane, J. F., Iams, J. D., and Romero, R. (2008). Epidemiology and causes of preterm birth. lancet 371, 75–84. doi:10.1016/S0140-6736(08)60074-4
Gross, G. A., Imamura, T., Luedke, C., Vogt, S. K., Olson, L. M., Nelson, D. M., et al. (1998). Opposing actions of prostaglandins and oxytocin determine the onset of murine labor. Proc. Natl. Acad. Sci. 95, 11875–11879. doi:10.1073/pnas.95.20.11875
Haddock, R., and Hill, C. (2002). Differential activation of ion channels by inositol 1, 4, 5-trisphosphate (IP3)-and ryanodine-sensitive calcium stores in rat basilar artery vasomotion. J. physiology 545, 615–627. doi:10.1113/jphysiol.2002.027904
Horowitz, A., Menice, C. B., Laporte, R., and Morgan, K. G. (1996). Mechanisms of smooth muscle contraction. Physiol. Rev. 76, 967–1003. doi:10.1152/physrev.1996.76.4.967
Ito, S., Sakamoto, K., Mochizukioda, N., Ezashi, T., Miwa, K., Okudaashitaka, E., et al. (1994). Prostaglandin F2 alpha receptor is coupled to Gq in cDNA-transfected Chinese hamster ovary cells. Biochem. biophysical Res. Commun. 200, 756–762. doi:10.1006/bbrc.1994.1515
Kamm, K. E., and Stull, J. T. (1985). The function of myosin and myosin light chain kinase phosphorylation in smooth muscle. Annu. Rev. Pharmacol. Toxicol. 25, 593–620. doi:10.1146/annurev.pa.25.040185.003113
Karim, S. (1968). Appearance of prostaglandin F2-alpha in human blood during labour. Br. Med. J. 4, 618–621. doi:10.1136/bmj.4.5631.618
Kelly, A. J., Malik, S., Smith, L., Kavanagh, J., and Thomas, J. (2009). Vaginal prostaglandin (PGE2 and PGF2a) for induction of labour at term. Cochrane database Syst. Rev., CD003101. doi:10.1002/14651858.CD003101.pub2
Lamont, R. F., and Jørgensen, J. S. (2019). Safety and efficacy of tocolytics for the treatment of spontaneous preterm labour. Curr. Pharm. Des. 25, 577–592. doi:10.2174/1381612825666190329124214
Lee, S. E., Park, I.-S., Romero, R., and Yoon, B. H. (2009). Amniotic fluid prostaglandin F2 increases even in sterile amniotic fluid and is an independent predictor of impending delivery in preterm premature rupture of membranes. J. Maternal-Fetal Neonatal Med. 22, 880–886. doi:10.1080/14767050902994648
Le Gouill, C., Devost, D., Zingg, H. H., Bouvier, M., Saragovi, H. U., Pétrin, D., et al. (2010). A novel biased allosteric compound inhibitor of parturition selectively impedes the prostaglandin F2alpha-mediated Rho/ROCK signaling pathway. J. Biol. Chem. 285, 25624–25636. doi:10.1074/jbc.M110.115196
Lundström, V., and Bygdeman, M. (1986). “Induction of labour at term with prostaglandins,” in Control and Management of Parturition: Proceedings of the 23rd Baudelocque Symposium on Control and Management of Parturition, Held in Paris, 1-3 May, 1986 (Incorporated: Scientific & Medical Publications of France), 119.
Maclennan, A., and Green, R. (1979). CERVICAL RIPENING AND INDUCTION OF LABOUR WITH INTRAVAGINAL PROSTAGLANDIN F2$alpha;. Lancet 313, 117–119. doi:10.1016/s0140-6736(79)90515-4
Madsen, G., Zakar, T., Ku, C. Y., Sanborn, B. M., Smith, R., and Mesiano, S. (2004). Prostaglandins differentially modulate progesterone receptor-A and-B expression in human myometrial cells: evidence for prostaglandin-induced functional progesterone withdrawal. J. Clin. Endocrinol. metabolism 89, 1010–1013. doi:10.1210/jc.2003-031037
Mangham, L. J., Petrou, S., Doyle, L. W., Draper, E. S., and Marlow, N. (2009). The cost of preterm birth throughout childhood in England and Wales. Pediatrics 123, e312–e327. doi:10.1542/peds.2008-1827
Martos, J. L., Woodward, D. F., Wang, J. W., Dabbs, S., and Kangasmetsa, J. J. (2016). Antagonists acting at multiple prostaglandin receptors for the treatment of inflammation.: W02015113057.
Matsumoto, T., Sagawa, N., Yoshida, M., Mori, T., Tanaka, I., Mukoyama, M., et al. (1997). The prostaglandin E2 and F2 alpha receptor genes are expressed in human myometrium and are down-regulated during pregnancy. Biochem. biophysical Res. Commun. 238, 838–841. doi:10.1006/bbrc.1997.7397
Merlino, A. A., Welsh, T. N., Tan, H., Yi, L. J., Cannon, V., Mercer, B. M., et al. (2007). Nuclear progesterone receptors in the human pregnancy myometrium: evidence that parturition involves functional progesterone withdrawal mediated by increased expression of progesterone receptor-A. J. Clin. Endocrinol. Metabolism 92, 1927–1933. doi:10.1210/jc.2007-0077
Mitchell, M., Romero, R., Edwin, S., and Trautman, M. (1995). Prostaglandins and parturition. Reproduction, Fertil. Dev. 7, 623–632. doi:10.1071/rd9950623
Mukhopadhyay, P., Bian, L., Yin, H., Bhattacherjee, P., and Paterson, C. A. (2001). Localization of EP1 and FP receptors in human ocular tissues by in situ hybridization. Investigative Ophthalmol. Vis. Sci. 42, 424–428.
Oga, T., Matsuoka, T., Yao, C., Nonomura, K., Kitaoka, S., Sakata, D., et al. (2009). Prostaglandin F(2alpha) receptor signaling facilitates bleomycin-induced pulmonary fibrosis independently of transforming growth factor-beta. Nat. Med. 15, 1426–1430. doi:10.1038/nm.2066
O'Hare, M. J., Bond, J., Clarke, C., Takeuchi, Y., Atherton, A. J., Berry, C., et al. (2001). Conditional immortalization of freshly isolated human mammary fibroblasts and endothelial cells. Proc. Natl. Acad. Sci. 98, 646–651. doi:10.1073/pnas.98.2.646
Olson, D. M. (2003). The role of prostaglandins in the initiation of parturition. Best Pract. Res. Clin. obstetrics Gynaecol. 17, 717–730. doi:10.1016/s1521-6934(03)00069-5
Pfaffl, M. W. (2001). A new mathematical model for relative quantification in real-time RT–PCR. Nucleic acids Res. 29, e45. doi:10.1093/nar/29.9.e45
Phillippe, M., Saunders, T., and Basa, A. (1997). Intracellular mechanisms underlying prostaglandin F2alpha-stimulated phasic myometrial contractions. Am. J. Physiology-Endocrinology Metabolism 273, E665–E673. doi:10.1152/ajpendo.1997.273.4.E665
Pohl, O., Chollet, A., Kim, S. H., Riaposova, L., Spézia, F., Gervais, F., et al. (2018). OBE022, an oral and selective prostaglandin F2<sub>α</sub> receptor antagonist as an effective and safe modality for the treatment of preterm labor. J. Pharmacol. Exp. Ther. 366, 349–364. doi:10.1124/jpet.118.247668
Pohl, O., Marchand, L., Gotteland, J. P., Coates, S., Täubel, J., and Lorch, U. (2019). Coadministration of the prostaglandin F2α receptor antagonist preterm labour drug candidate OBE022 with magnesium sulfate, atosiban, nifedipine and betamethasone. Br. J. Clin. Pharmacol. 85, 1516–1527. doi:10.1111/bcp.13925
Schwarz, M. K., and Page, P. (2003). Preterm labour: an overview of current and emerging therapeutics. Curr. Med. Chem. 10, 1441–1468. doi:10.2174/0929867033457331
Senior, J., Marshall, K., Sangha, R., and Clayton, J. (1993). In vitro characterization of prostanoid receptors on human myometrium at term pregnancy. Br. J. Pharmacol. 108, 501–506. doi:10.1111/j.1476-5381.1993.tb12832.x
Sharma, S., Hibbard, B., Hamlett, J., and Fitzpatrick, R. (1973). Prostaglandin F 2 concentrations in peripheral blood during the first stage of normal labour. Br. Med. J. 1, 709–711. doi:10.1136/bmj.1.5855.709
Silvia, W. J., and Homanics, G. E. (1988). Role of phospholipase C in mediating oxytocin-induced release of prostaglandin F2 alpha from ovine endometrial tissue. Prostaglandins 35, 535–548. doi:10.1016/0090-6980(88)90029-9
Thomas, J., Fairclough, A., Kavanagh, J., and Kelly, A. J. (2014). Vaginal prostaglandin (PGE2 and PGF2a) for induction of labour at term. Cochrane Database Syst. Rev. 2014, CD003101. doi:10.1002/14651858.CD003101.pub3
Vogel, J. P., Nardin, J. M., Dowswell, T., West, H. M., and Oladapo, O. T. (2014). Combination of tocolytic agents for inhibiting preterm labour. Cochrane Database Syst. Rev. 2014, CD006169. doi:10.1002/14651858.CD006169.pub2
Walani, S. R. (2020). Global burden of preterm birth. Int. J. Gynecol. Obstetrics 150, 31–33. doi:10.1002/ijgo.13195
Wood, E. M., Hornaday, K. K., and Slater, D. M. (2021). Prostaglandins in biofluids in pregnancy and labour: a systematic review. PloS one 16, e0260115. doi:10.1371/journal.pone.0260115
Wray, S., and Prendergast, C. (2019). The myometrium: from excitation to contractions and labour. Smooth Muscle Spontaneous Act. 1124, 233–263. doi:10.1007/978-981-13-5895-1_10
Xu, C., Long, A., Fang, X., Wood, S. L., Slater, D. M., Ni, X., et al. (2013). Effects of PGF2α on the expression of uterine activation proteins in pregnant human myometrial cells from upper and lower segment. J. Clin. Endocrinol. Metabolism 98, 2975–2983. doi:10.1210/jc.2012-2829
Keywords: myometrium, PGF2α, FP receptor, FP antagonists, smooth muscle, labour, preterm birth
Citation: Hamshaw I, Straube A, Stark R, Baxter L, Alam MT, Wever WJ, Yin J, Yue Y, Pinton P, Sen A, Ferguson GD and Blanks AM (2023) PGF2α induces a pro-labour phenotypical switch in human myometrial cells that can be inhibited with PGF2α receptor antagonists. Front. Pharmacol. 14:1285779. doi: 10.3389/fphar.2023.1285779
Received: 30 August 2023; Accepted: 21 November 2023;
Published: 14 December 2023.
Edited by:
Robert Garfield, University of Arizona, United StatesReviewed by:
Stella Liong, RMIT University, AustraliaJennifer Herington, Vanderbilt University Medical Center, United States
Copyright © 2023 Hamshaw, Straube, Stark, Baxter, Alam, Wever, Yin, Yue, Pinton, Sen, Ferguson and Blanks. This is an open-access article distributed under the terms of the Creative Commons Attribution License (CC BY). The use, distribution or reproduction in other forums is permitted, provided the original author(s) and the copyright owner(s) are credited and that the original publication in this journal is cited, in accordance with accepted academic practice. No use, distribution or reproduction is permitted which does not comply with these terms.
*Correspondence: Andrew M. Blanks, andrew.blanks@warwick.ac.uk
†Present address: Mohammad T. Alam, Department of Biology, College of Science, United Arab Emirates University, Abu Dhabi, United Arab Emirates