The EMSO Generic Instrument Module (EGIM): Standardized and Interoperable Instrumentation for Ocean Observation
 Nadine Lantéri1,2*
  Henry A. Ruhl3,4
  Andrew Gates2,3 Enoc Martínez2,5
  Joaquin del Rio Fernandez2,5
  Jacopo Aguzzi6,7
  Mathilde Cannat2,8
  Eric Delory2,9
  Davide Embriaco2,10
  Robert Huber11
  Marjolaine Matabos1
  George Petihakis2,12
  Kieran Reilly2,13 Jean-François Rolin1,2
  Mike van der Schaar5 Michel André5
  Jérôme Blandin1,2
  Andrés Cianca9
  Marco Francescangeli5 Oscar Garcia14
  Susan Hartman2,3 Jean-Romain Lagadec1 Julien Legrand1 Paris Pagonis2,12
  Jaume Piera14 Xabier Remirez9
  Daniel M. Toma2,5
  Giuditta Marinaro2,10 Bertrand Moreau1 Raul Santana9 Hannah Wright3
  Juan José Dañobeitia2,15
  Paolo Favali2,10
- 1Institut Français de Recherche pour l’Exploitation de la Mer, Plouzané, France
- 2European Multidisciplinary Seafloor and Water Column Observatory, Rome, Italy
- 3National Oceanography Centre, Southampton, United Kingdom
- 4Monterey Bay Aquarium, Research Institute, Moss Landing, CA, United States
- 5Universitat Politècnica de Catalunya, Vilanova i la Geltrú, Spain
- 6Department of Renewable Marine Resources, Functioning and Vulnerability of Marine Ecosystems Group, Instituto de Ciencias del Mar (ICM-CSIC), Barcelona, Spain
- 7Stazione Zoologica Anton Dohrn (SZN), Naples, Italy
- 8Institut de Physique du Globe de Paris, Centre National de la Recherche Scientifique, Paris, France
- 9Plataforma Oceánica de Canarias, Telde, Spain
- 10Istituto Nazionale di Geofisica e Vulcanologia, Rome, Italy
- 11MARUM – Zemtrum für, Marine Umweltwissenschaften der Universität Bremen, Bremen, Germany
- 12Hellenic Centre for marine Research, Attiki, Greece
- 13Marine Institute, Galway, Ireland
- 14Instituto de Ciencias del Mar, Consejo Superior de Investigaciones Científicas (CSIC), Barcelona, Spain
- 15Unidad de Tecnologia Marina, Consejo Superior de Investigaciones Científicas (CSIC), Barcelona, Spain
The oceans are a fundamental source for climate balance, sustainability of resources and life on Earth, therefore society has a strong and pressing interest in maintaining and, where possible, restoring the health of the marine ecosystems. Effective, integrated ocean observation is key to suggesting actions to reduce anthropogenic impact from coastal to deep-sea environments and address the main challenges of the 21st century, which are summarized in the UN Sustainable Development Goals and Blue Growth strategies. The European Multidisciplinary Seafloor and water column Observatory (EMSO), is a European Research Infrastructure Consortium (ERIC), with the aim of providing long-term observations via fixed-point ocean observatories in key environmental locations across European seas from the Arctic to the Black Sea. These may be supported by ship-based observations and autonomous systems such as gliders. In this paper, we present the EMSO Generic Instrument Module (EGIM), a deployment ready multi-sensor instrumentation module, designed to measure physical, biogeochemical, biological and ecosystem variables consistently, in a range of marine environments, over long periods of time. Here, we describe the system, features, configuration, operation and data management. We demonstrate, through a series of coastal and oceanic pilot experiments that the EGIM is a valuable standard ocean observation module, which can significantly improve the capacity of existing ocean observatories and provides the basis for new observatories. The diverse examples of use included the monitoring of fish activity response upon oceanographic variability, hydrothermal vent fluids and particle dispersion, passive acoustic monitoring of marine mammals and time series of environmental variation in the water column. With the EGIM available to all the EMSO Regional Facilities, EMSO will be reaching a milestone in standardization and interoperability, marking a key capability advancement in addressing issues of sustainability in resource and habitat management of the oceans.
Introduction
Need for Long-Term Ocean Observation
The oceans provide food, mineral resources, energy, host a very rich biodiversity and regulate our climate. The sustainability of these services is subject to local and global scale changes including warming, deoxygenation, acidification, overfishing and pollution. Society has a strong and pressing interest in maintaining and where possible restoring the health and resilience of the ocean ecosystem. The measures to address these major challenges of the 21st century are encapsulated in the UN Sustainable Development Goals (Visbeck, 2018), the Blue Growth strategies and various statutory environmental programmes, such as, in Europe, the Marine Strategy Framework Directive (MSFD)1 (Van der Graaf et al., 2012) or the OSPAR Commission2. To establish an initial assessment of the environmental status, to ensure consistency and allow for comparison, stakeholders throughout the ocean economy (civil society, research, industry, policymakers) require high-quality integrated observations in near real time, from the surface, through the water column, to sub-seafloor, over large spatial and temporal scales (Dañobeitia et al., 2020).
Effective ocean observation, forecast and monitoring of impacts, benefit from a clear guidance on the most relevant environmental factors to consider. The Global Ocean Observing System (GOOS)3 sets out Essential Ocean Variables (EOVs), parameters which are feasible to measure across platforms, and provide relevant information for conservation and management (Miloslavich et al., 2018). Europe’s Marine Strategy Framework Directive sets out eleven descriptors (The European Parliament and the Council of the European Union, 2008) to assess marine environmental status and establishes a strategy to preserve the marine environment and to protect resources of socio-economic value. In situ observatory technology has been underused in addressing these descriptors (Danovaro et al., 2016).
Long-term fixed-point observatories are indeed major contributors to a comprehensive description and understanding of the processes taking place in the oceans (Baptista et al., 2008; Favali et al., 2010; Levin et al., 2019; Weller et al., 2019). They provide multidisciplinary information on the variability of the oceans which are difficult to detect by other platforms (Bean et al., 2017). The continuous, high-resolution time series data makes long-term fixed-point observatories uniquely insightful in resolving decadal environmental trends required to understand effects of global climate change (Henson et al., 2016). They can record long-term variations over hours, days, months, seasons, years, as well as sudden, unpredictable events such as earthquakes and tsunamis (Lo Bue et al., 2021). Furthermore, the effective footprint estimated through modeling suggests that data from open-ocean observatories can be representative of wide areas for a variety of biogeochemistry parameters in surface waters (Henson et al., 2016).
European ocean observatories differ in their equipment and methodologies. Such technical and organizational heterogeneity has driven the need to establish a permanent and sustainable framework to adopt and develop standards and common tools. This will increase efficiency, optimize costs and resource allocations, enhance interoperability meeting the needs of scientists and generic users (Person et al., 2015). Independently operated, single discipline observatories to measure short-term change have been evolving into distributed infrastructures of multidisciplinary, long-term sustained regional installations. Global networks of ocean observatories are established and partners share a common strategic framework, scientific facilities, methods, equipment and expertise. Herein we describe the EGIM, a generic ocean sensor underwater system which has been developed through the collaboration of several nations with many ocean science disciplines and subsea observatories (e.g., Favali et al., 2015). We describe the system, from basic seagoing equipment through to data access, as defined in ESONET NoE, the European Sea Observatory NETwork of Excellence4 (Ruhl et al., 2011). Furthermore, we discuss the scientific value of this generic system through the evaluation of initial oceanic deployments.
European Multidisciplinary Seafloor and Water Column Observatory
The European Multidisciplinary Seafloor and water column Observatory (EMSO) European Research Infrastructure Consortium (ERIC) is a distributed research infrastructure, consisting of 14 instrumented sites5, also known as Regional Facilities, which measure a wide range of variables focused on the Essential Ocean Variables. Measurements are made throughout the water column to the seabed and address broad scientific disciplines including meteorology, physical oceanography, biogeochemistry, ecology and geo-hazards (Best et al., 2014, 2016; Lo Bue et al., 2021).
The EMSO Regional Facilities are distributed from the Nordic Seas through the mid-Atlantic Ridge across the Mediterranean to the Black Sea in a range of depths from oceanic abyssal plain to shallow water coastal sites (Figure 1). In the Atlantic, the distribution of EMSO Regional Facilities is constituted by EMSO-Azores, in the mid-oceanic ridge with focus on hydrothermal vent processes (e.g., Cannat et al., 2011), Porcupine Abyssal Plain-Sustained Observatory (PAP-SO), which provides long-term observations linking biogeochemical processes in surface waters through the water column to the abyssal benthos (e.g., Hartman et al., 2021) and the ESTOC site, north of the Canary Archipelago, which records long-term biogeochemistry time series (Santana-Casiano et al., 2007).
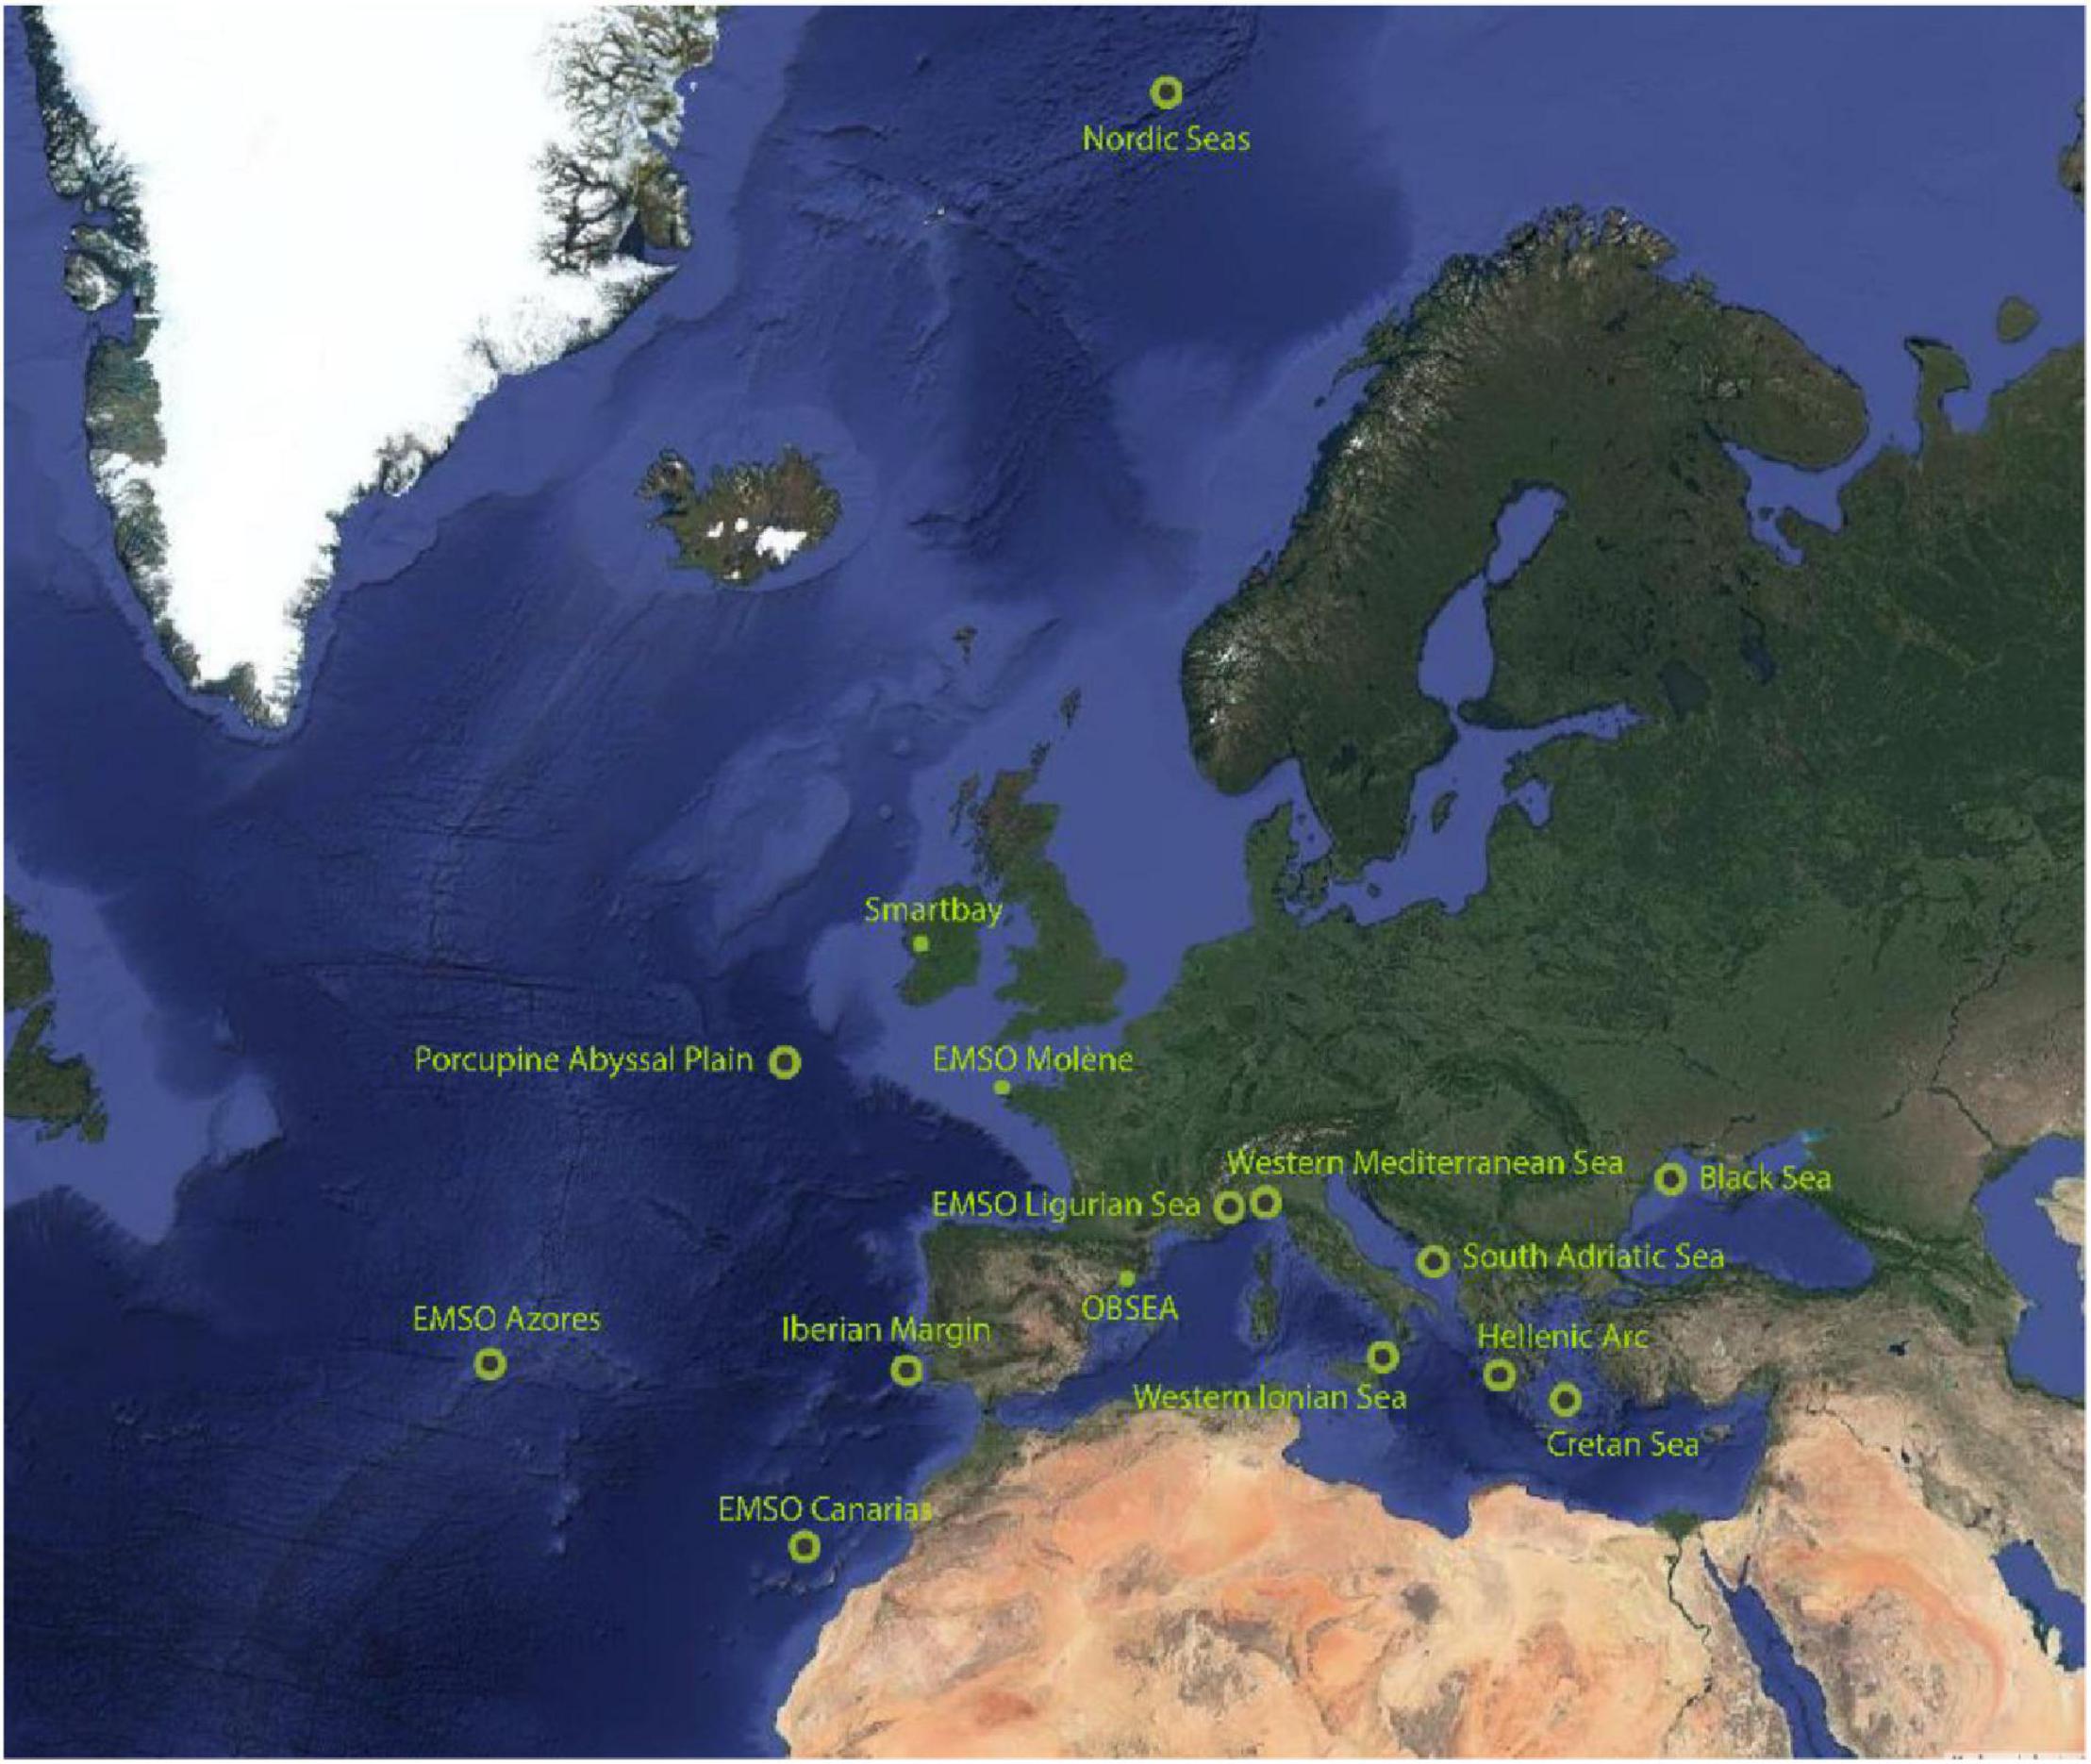
Figure 1. Geographical distribution of the EMSO Regional Facilities (open green circles) and test sites (solid green dots).
The EMSO Norwegian Regional Facility (NorEMSO) measures temporal and spatial changes in water masses in the Nordic Sea (e.g., Barreyre et al., 2020).
In the Mediterranean where most of the sites are cabled, the Regional Facilities are EMSO-Ligurian Sea, Western Ionian Sea and Hellenic Arc. EMSO-Ligurian Sea observes geo-hazards, biogeochemistry and physical oceanography at different locations ranging from 20 to 2,400 m water depth (e.g., Lefevre et al., 2019). The Western Ionian Sea Regional Facility has a focus mainly on geo-hazards and underwater acoustics (e.g., Monna et al., 2014). The Hellenic Arc Regional Facility monitors geo-hazards, physical oceanography and biogeochemistry (e.g., Lykousis et al., 2015). The Black Sea is monitored by the EuxRo buoys (e.g., Stanica and Melinte, 2020). At the time of the writing there are plans for the Regional Facilities on the Iberian Margin (Gulf of Cadiz).
There are also cabled sites in shallow water: Smart Bay (e.g., Gaughan et al., 2019), EMSO-Molène (Klingelhoefer et al., 2017) and OBSEA (e.g., del Rio et al., 2020) which provide real-time data and offer opportunities for more accessible in situ experimentation as well as development and testing of new technology.
The EMSO ERIC’s benefit is to add value to the Regional Facilities, taking advantage of the technologic and scientific excellence of each team to increase and harmonize the range of observed variables and enhance the interoperability. The development and deployment of the EGIM is a key step in completing this process.
EMSODEV (EMSO Implementation and Operation: DEVelopment of Instrument Module) Challenge
The Network of Excellence ESONET4 efforts helped to frame the idea to categorize observatory design concepts into those which are generic to all major observation sites and those which are more specialized (Ruhl et al., 2011). This idea evolved to drive specifications for an instrumentation and infrastructure module which meet generic requirements for various disciplines and science issues, and can also serve as a framework to host new and more complex sensors to address more specific scientific questions. A major obstacle to accelerating infrastructure implementation, improving impact and lowering average annual operation costs was the adoption of generic requirements which could facilitate the harmonization of infrastructure including hardware and information handling.
The EMSODEV6 EC project set out to construct a prototype and two replicated EGIMs with a set of core sensors. The concept was to not only set requirements, design the instrumentation, design data and power handling infrastructure, but also to prepare the EGIM full life cycle in the EMSO infrastructure and with important benefits regarding team building and technological capacity.
The design requirements and priorities for the prototype and early systems were constrained by a few principles. The EMSO strategic themes cover many disciplines and phenomena requiring a wide range of technical specifications. The design and selection of initial test cases for use of the EGIM was driven to demonstrate capability in both the water column and on the seafloor, together with the technical challenges of high data rate sensors and related interfacing. Additionally, the designs included both stand-alone systems with internal recording and power supply and cable systems with real time transmission of geophysical, acoustic and image/video data.
In this paper, we present a description of the EGIM system, features, set-up, operation and data management. We demonstrate, through a series of coastal and oceanic deployments, that the EGIM is a valuable ocean observation module, which can contribute to address questions which link physical, biogeochemical, biological and ecosystem variables and significantly enhance the capability of the existing observatories.
The EGIM Description
Main Features
The EGIM serves EMSO ambitions for interoperability, flexibility and capability for future evolution, reliability and data quality standardization, to measure ocean variables throughout the Regional Facilities.
Standardization to Measure the Essential Ocean Variables Homogeneously Across EMSO
The central feature of EGIM is a standardized approach to measure a set of significant oceanographic variables: this is achieved by using consistent sensor and hardware specifications and deployment concepts, the same setting for each sensor, the same qualification and calibration methods and the same data format.
Compatibility With the Various Site Configurations, Deployment Scenario and Scientific Disciplines
Embedded in an easy-to-deploy frame, the EGIM meets very diverse implementation scenarios and multidisciplinary scientific purposes whilst keeping a generic design. It can operate on any EMSO Regional Facility, mooring line, seabed station both cabled and non-cabled, surface buoy and can host a variety of sensors. The EGIM can also be deployed as a completely independent system. In this case, it may be necessary to add buoyancy, an acoustic releaser and a set of beacons to recover the system from the surface. The specifications include a depth rating of 6,000 m so that any sensor could be deployed in all European seas. However, shallow ratings can be specified for given units.
Adaptable to Existing and New Technologies
The EGIM is open to user customization. The communication protocols with the sensors, the external communications and the power links are standard and non-proprietary, consequently, the EGIM can easily accommodate additional instruments and data types.
Building on Global Best Practice
The EGIM development process has benefited from EMSO community knowledge and extensive, operational experience of deployments at sea, and complies with the recommendations and best practices gathered by European Ocean Observing community (Pearlman et al., 2019), developed through projects such as the Best Practices Handbook by the project FixO3-Fixed-point Open Ocean Observatories4 (Coppola et al., 2016) and the Network of Excellence ESONET4 Label. The EGIM also complies with NF-X10-812 environmental test specifications (NF X10-812, 2013).
High-Quality Data
Full data lifecycle traceability is implemented to fulfill EMSO objectives of high quality and consistent measurements. It induces constraints to the purchasing and maintenance processes. Then, performing standardized tests and calibration is of prime importance to ensure interchangeability, compatibility and harmonization. Finally, the detailed information must be attached to the data sets as durable metadata.
The EGIM Sub-Systems
The EGIM is made of the sensors, an electronic core, power supply and an optional interface to optical cable, integrated in a compact frame (Figure 2).
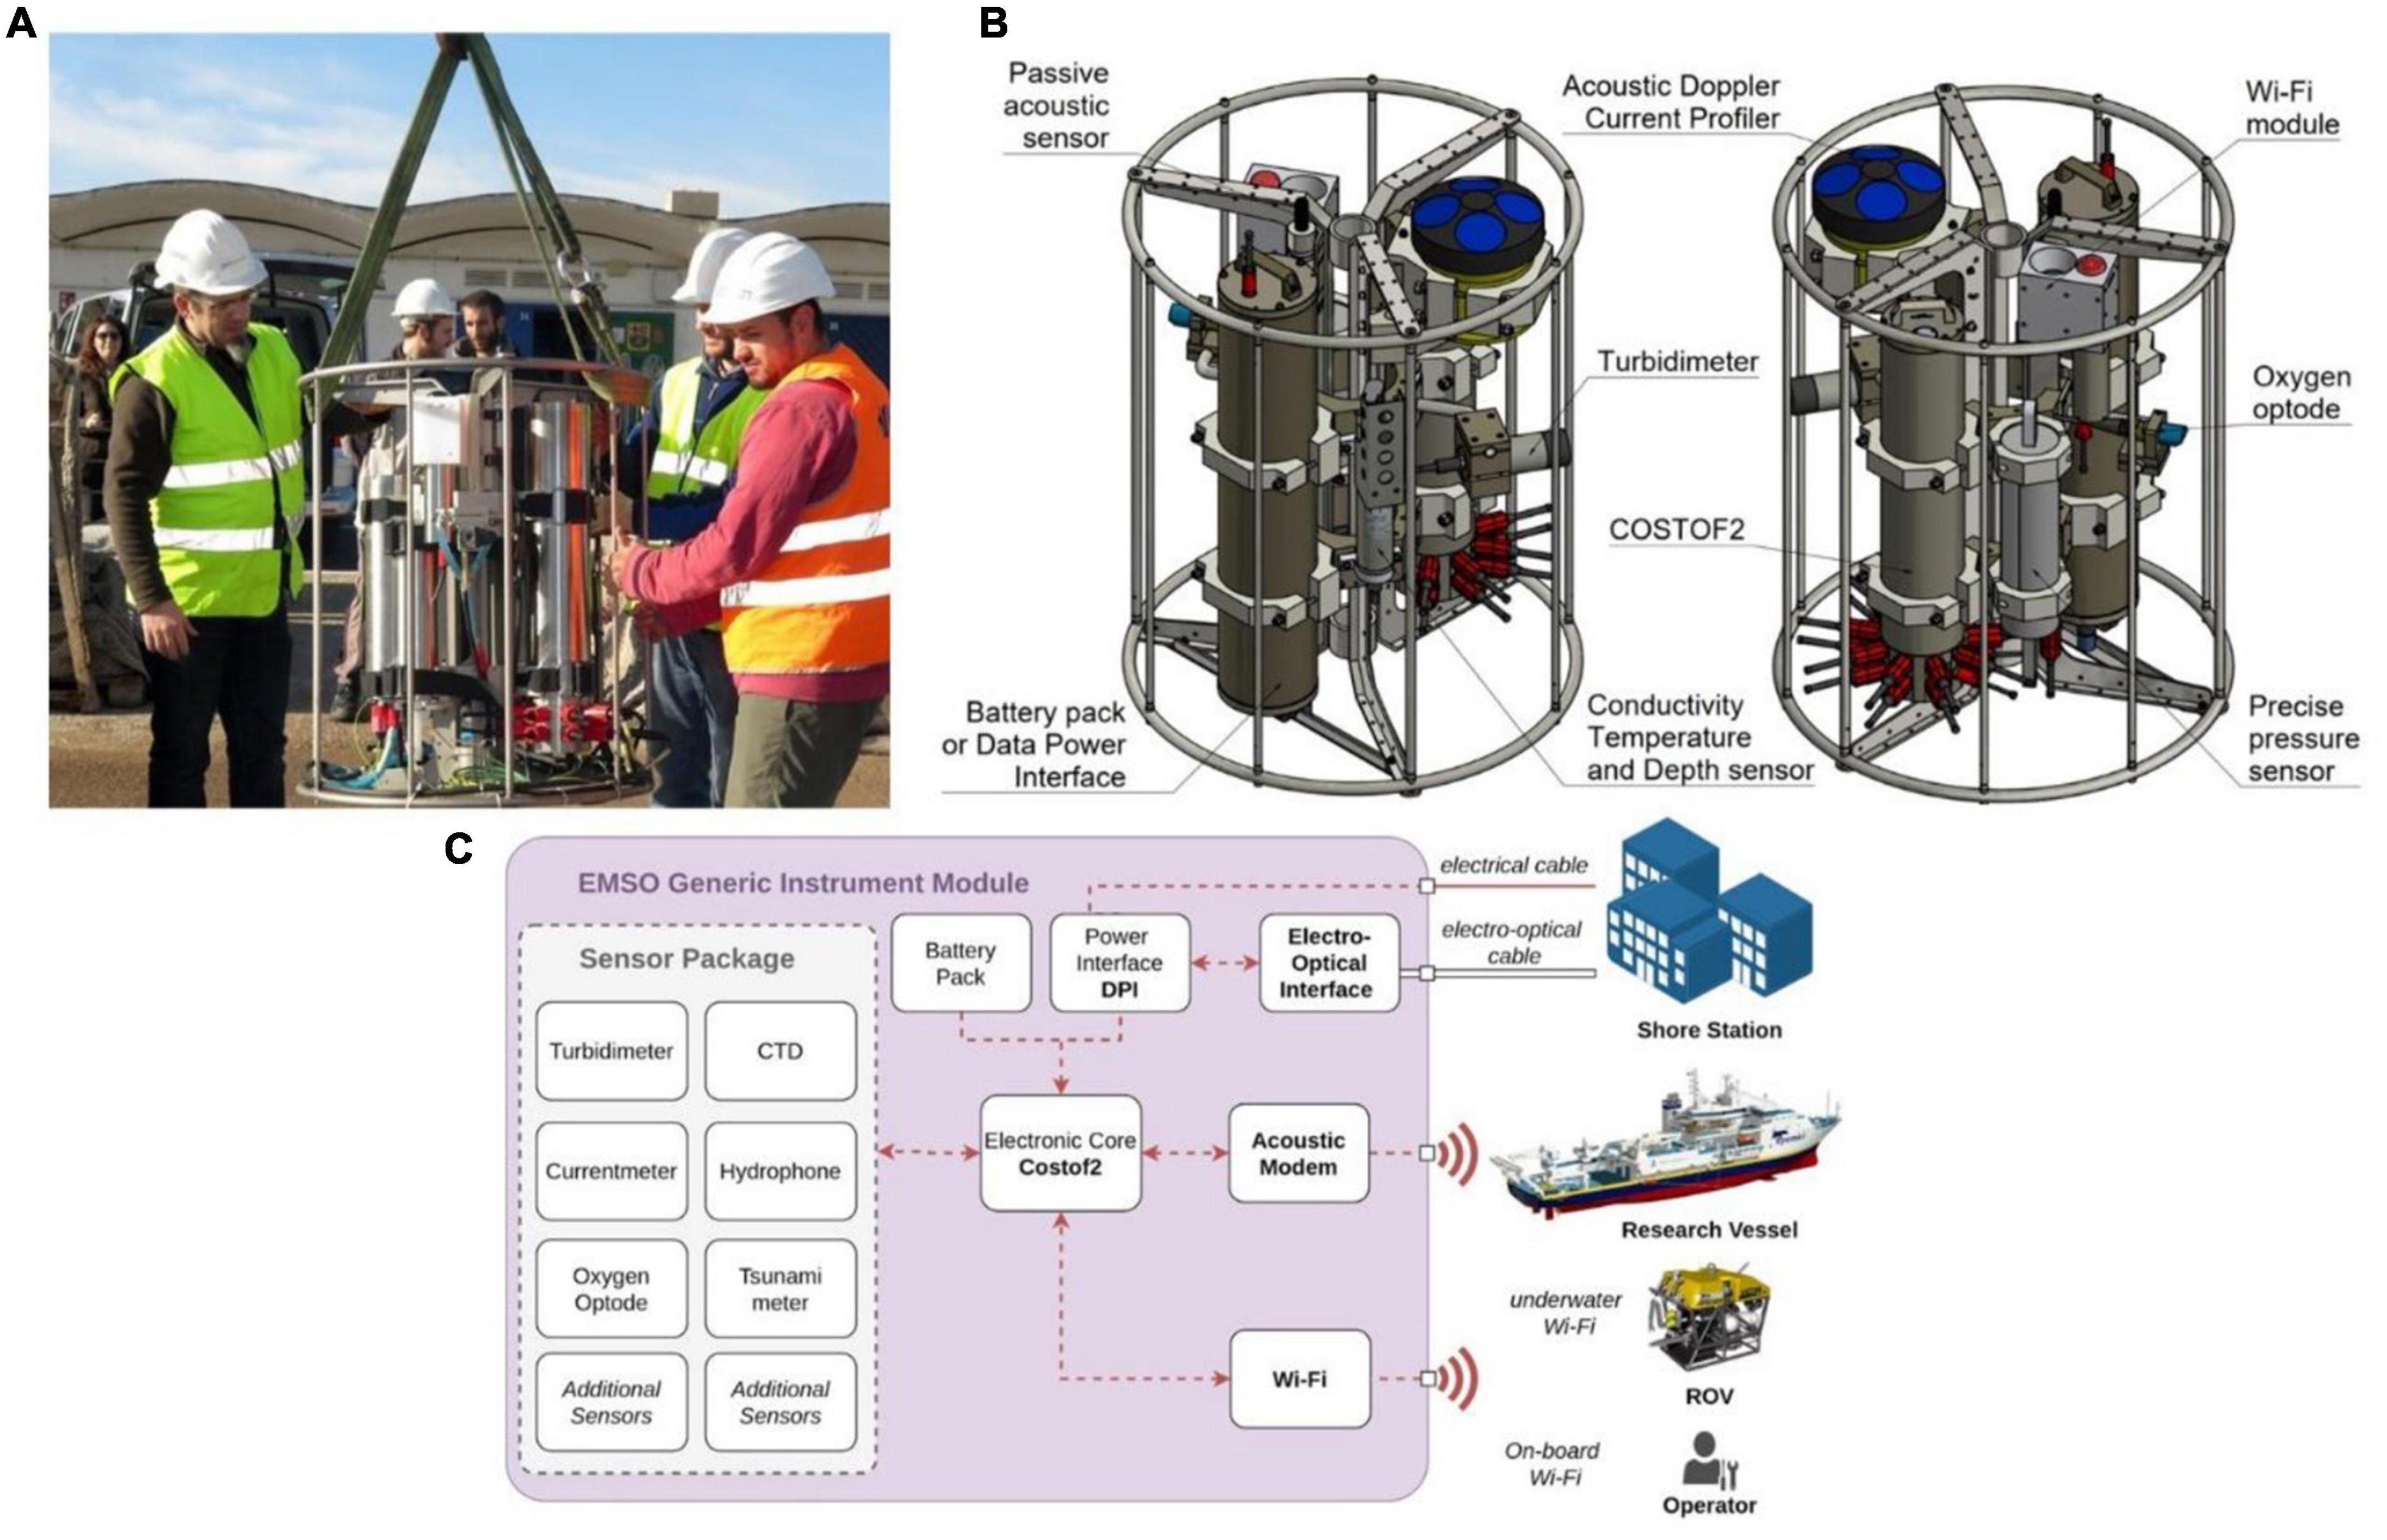
Figure 2. (A) The EGIM assembled and ready for deployment (B) view of the sensors and components and (C) sensors diagram with communication services.
The Core Sensors
The identification of scientific core parameter requirements has followed a decade-long investigation of scientific priorities and the potential for sensors to meet those requirements. The benchmark at the start of the EMSODEV6 EC project was set by the Network of Excellence ESONET4 in 2011, which included a set of seven generic variables and several other specialist ones (Ruhl et al., 2011). This benchmarking importantly included input from other related EU projects including the projects EuroSITES5 Open-Ocean Observatory and the Hotspot Ecosystem Research and Man’s Impact on European Seas (HERMIONE7). The previous exercise also referenced developing concepts such as the Global Climate Observing System (GCOS8) Essential Climate Variables. Refining the requirements which led to the construction of the first EGIM units included expert inputs via workshops (e.g., in Heraklion, Greece, 2015). The entire process was carried out with reference to relevance with multiple disciplines, detailed specification and wide existing usage. Commercial availability and Technology Readiness Level (TRL9), depth rating, and cost were also selection factors in what could be included in the first EGIM units.
The seven core parameters selected for the first EGIM units can be found in Table 1.
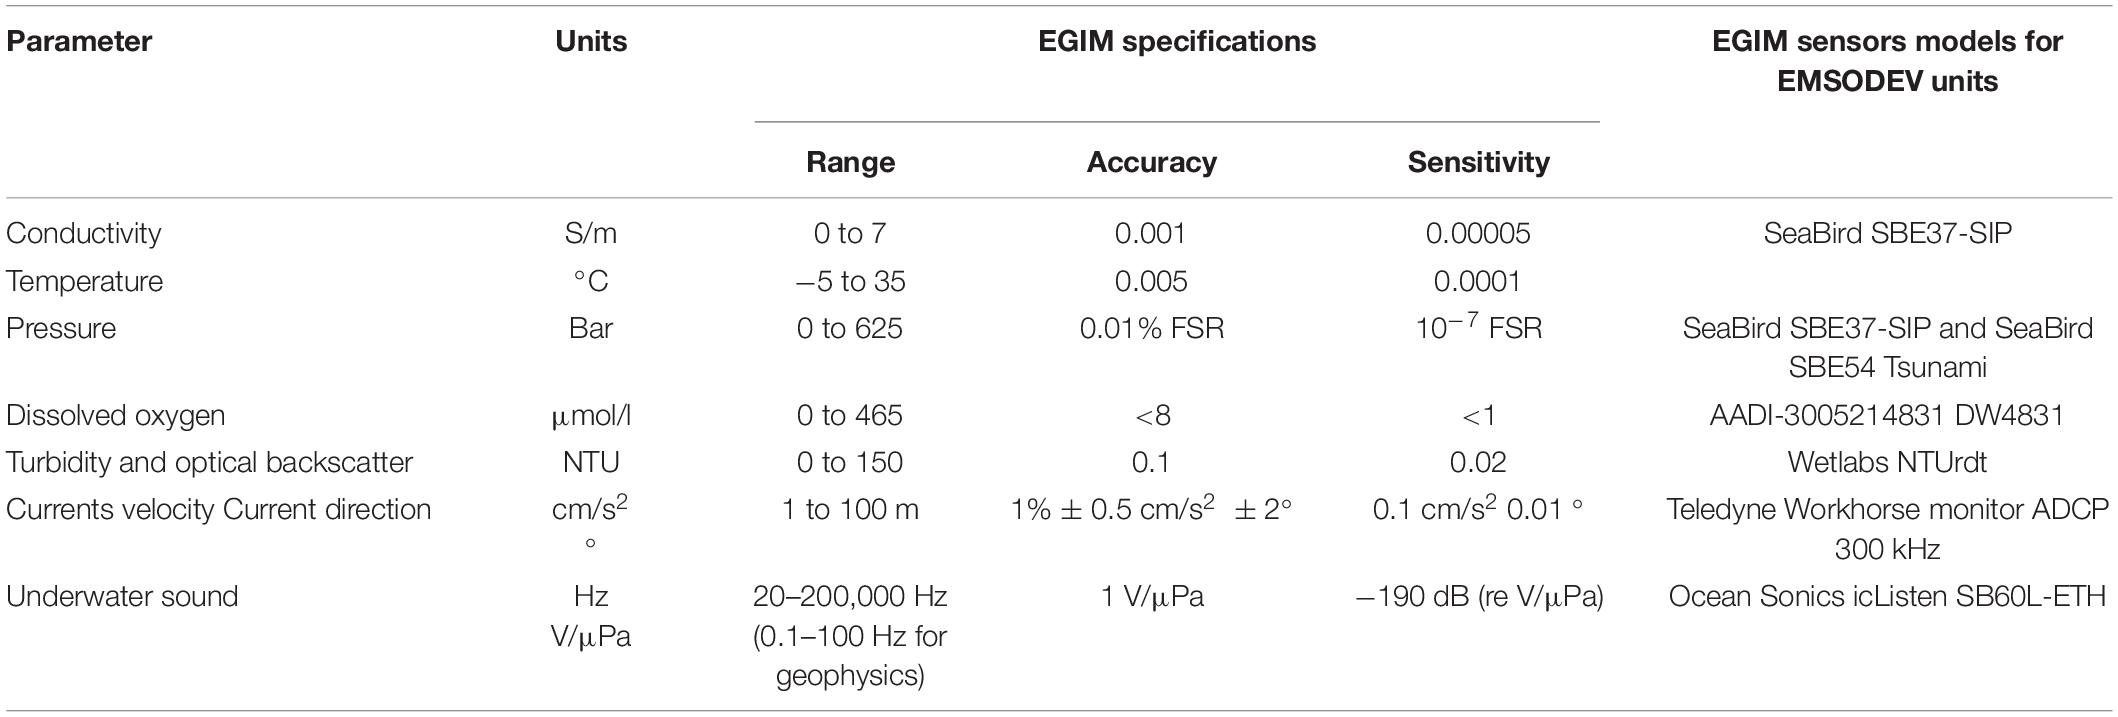
Table 1. Specification for the first set of variables and sensors.
The Electronic Core
The electronic core of the EGIM is the COSTOF2 (2nd generation of COmmunication and STOrage Front-end), an optimal mix of innovation and reliability. Recently developed and already proven in long-term deployments, it benefits from more than 10 years deployment on EMSO-Azores of the previous generation of the instrument: the initial deployment was carried out in 2006 within the European project ASSEM – Array of sensors for long-term seabed monitoring of geohazards5 (Legrand et al., 2019). Primarily designed for non-cabled applications, the system perfectly matches constraints of EMSO stand-alone Regional Facilities.
Within the EGIM, the electronic core provides adaptive power supply, measurement sequencing, data storage with redundancy, data time stamping with a clock common to all the sensors and high precision where necessary (less than 9.10–10 aging monthly), technical data such as internal temperature, internal humidity, power consumption, leakage detection and storage capacity to monitor the correct functionality of the module. The various bi-directional communications available on-board, underwater locally and remotely from the sea surface (Figure 2C) use standard and non-proprietary protocols. These protocols include serial and Ethernet, high-bandwidth contactless Wi-Fi operating in situ and optimized protocols for acoustic, inductive and satellite transmission.
The electronic core also provides the EGIM with customization and evolution capacities. With a user-friendly all-in-one configuration tool, users can adjust the configuration of the EGIM with regard to the deployment scenario and setup the instrument-specific parameters such as power consumption, event logging and acquisition duty cycle. With a Sensor Software Development on Kit, the users can develop new sensor interfaces thus contributing to extend the list of existing sensor drivers.
Protection Against Bio-Fouling
The EGIM can manage external antifouling systems and for non-equipped industrial sensors, it has a built-in active antifouling device based on micro-chlorinator. This feature is essential to ensure the data quality over time for oxygen, turbidity and images.
Power Supply: Power Converter Unit and Batteries Compatible
For standalone applications, the EGIM can be powered by primary lithium-thionyl chloride battery packs delivering a 28 V DC nominal voltage. For high voltage cabled installations, typically 300–400 V DC, a data-power interface unit converts the node power voltage to 30 V DC.
Optical Fiber Interface
Communication at cabled Regional Facilities uses optical fiber which can handle bidirectional large data traffic over long distances. In the world market of subsea optical connectors, EMSO has not yet been able to address standardization. Nonetheless, in order to provide a cost-effective solution, a dedicated module with an Ethernet optical converter was implemented in a separate canister to convert the signal transmitted via the fiber to Ethernet wire link accepted by the EGIM.
System Setup
In the EGIM, each sensor is placed in the best orientation and mechanical setting to ensure optimal performance (Figure 2B). The space in front of the optical and acoustic sensors is free from obstructions to avoid any interference, reflection or wave spreading shadowing. The Acoustic Doppler Current Profiler (ADCP) is placed vertically with respect to the seabed, facing either upwards or downwards.
The frame is compact (965 mm high, Ø 780 mm, weight 115 daN in air and 56 daN in sea-water), robust and easy-to-deploy (Figure 2A). The triple “C” shape central part handles the mechanical strains and vibration. The external protection rings and beams are exchangeable. For the first units, the frame was made of titanium, but other materials can be used depending on corrosion compatibility, mechanical constraints and operating depth.
The EGIM can easily be attached at the top or at the bottom to an external frame and the central space is intended as an interface to the pin used on moorings.
EGIM Operation and Data Management
Configuration and Operating Modes
The EGIM provides a high level of customization thus fits for various deployment scenario in non-cabled, autonomous and cabled conditions (Figure 3).
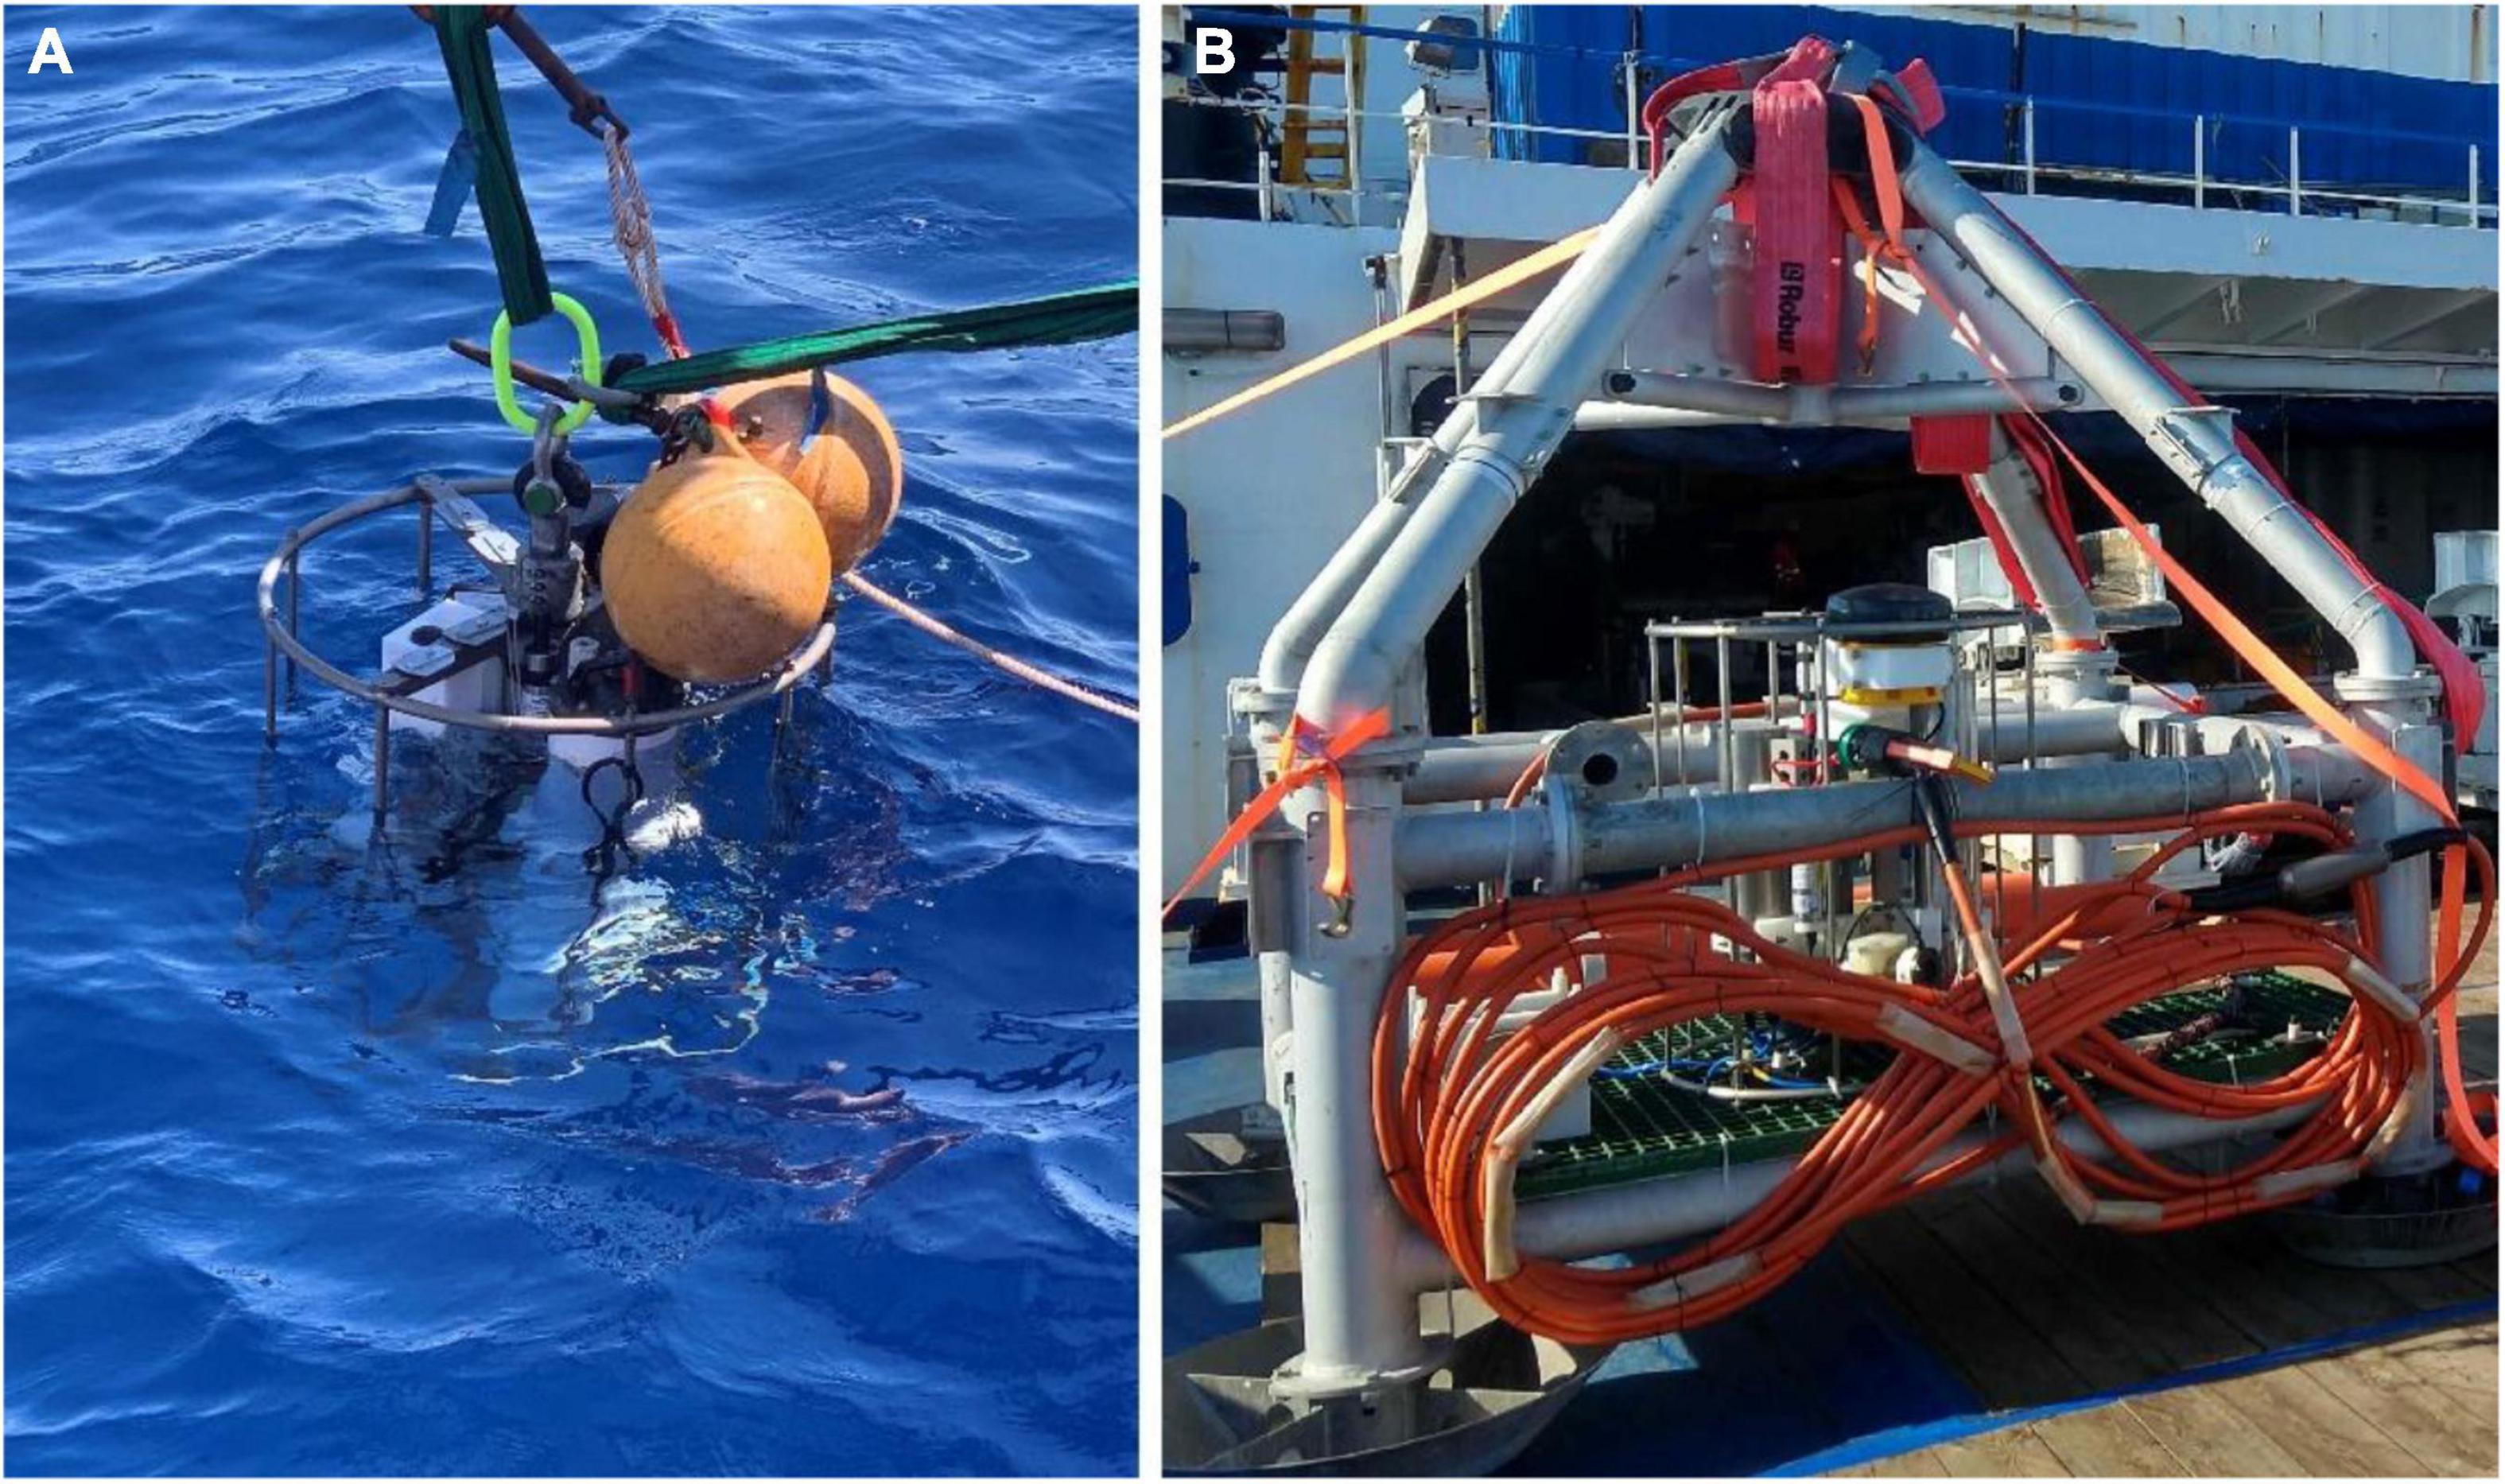
Figure 3. The EGIM (A) in a mooring line during the deployment in autonomous mode on ESTOC test site and (B) inside the pyramidal frame used at Western Ionian Sea with the electro-optical converter and the 50 m electro optical jumper for the connection to the submarine cable of the infrastructure.
Non-cabled and Autonomous Modes
The non-cabled mode and the autonomous mode are configurations when the EGIM is battery operated with no, or few, external guidance and limited communication with the shore generally available through an acoustic link.
To manage the equipment (e.g., sensors, motors, pumps, antifouling devices) in these situations, the system relies on a set of non-proprietary sensor-specific drivers embedded in the EGIM electronic core COSTOF2.
The bi-directional communication services (see section “The Electronic Core”) make it possible, to perform a final in situ check when deploying with a visiting/installing submersible, divers or an acoustic link, to adjust the acquisition routine and to recover scientific or technical data.
Cabled Mode
In cabled mode, the EGIM is connected to a shore station through an underwater electro-optical cable with an electro-optical converter at the end, offering continuous power supply and real-time, high bandwidth communication. The EGIM electronic core operates as a transparent junction box between the shore and the sensors, providing access to the sensors through the standard internet transmission control protocol (TCP/IP) and providing a serial to Ethernet converter for the instruments with no Ethernet interface.
The EGIM can face short-term failure in power supply and/or Ethernet communication and maintain the data series continuity: in case of power loss, the EGIM electronic core, running on internal backup batteries, switches from cabled to non-cabled mode and manages the system operation, regularly testing the connection with the shore (power and communication) to return to the nominal cabled mode. When the batteries are exhausted, the system turns to a secure mode with the sensors switched off and the electronic core in a sleep state.
In cabled mode, there is an option of associated on shore cyber-infrastructure available to the EGIM users’ community to manage the real-time scientific and technical data and metadata acquisition, to access and monitor the EGIM throughout the deployment and to carry out the connection to any data infrastructure (Figure 4). The overall cyber-infrastructure has been designed to meet FAIR data principles (Wilkinson et al., 2016) meaning the data are Findable, Accessible, Interoperable and Reusable for machine to machine networking. It is composed of several virtual machines (VM). All the components and third-party software have open-source and permissive licenses. It uses Open Geospatial Consortium’s Sensor Web Enablement (SWE) worldwide acknowledged standards, tools and services (Bröring et al., 2011), which are free and publicly available. This, in turn, makes linking of diverse sensors fast and practical: the Sensor Model Language-SensorML to describe the instrument and acquisition process metadata (Botts and Robin, 2014), the Sensor Web Enablement (SWE) bridge software to provide plug and play instrument integration (Martínez et al., 2017), the Sensor Observation Service (SOS)10 (Bröring et al., 2012) to serve the sensor data and metadata in a standard and interoperable manner on the web and the Helgoland lightweight Sensor Web Viewer11 to enable the exploration, visualization and analysis of sensor data.
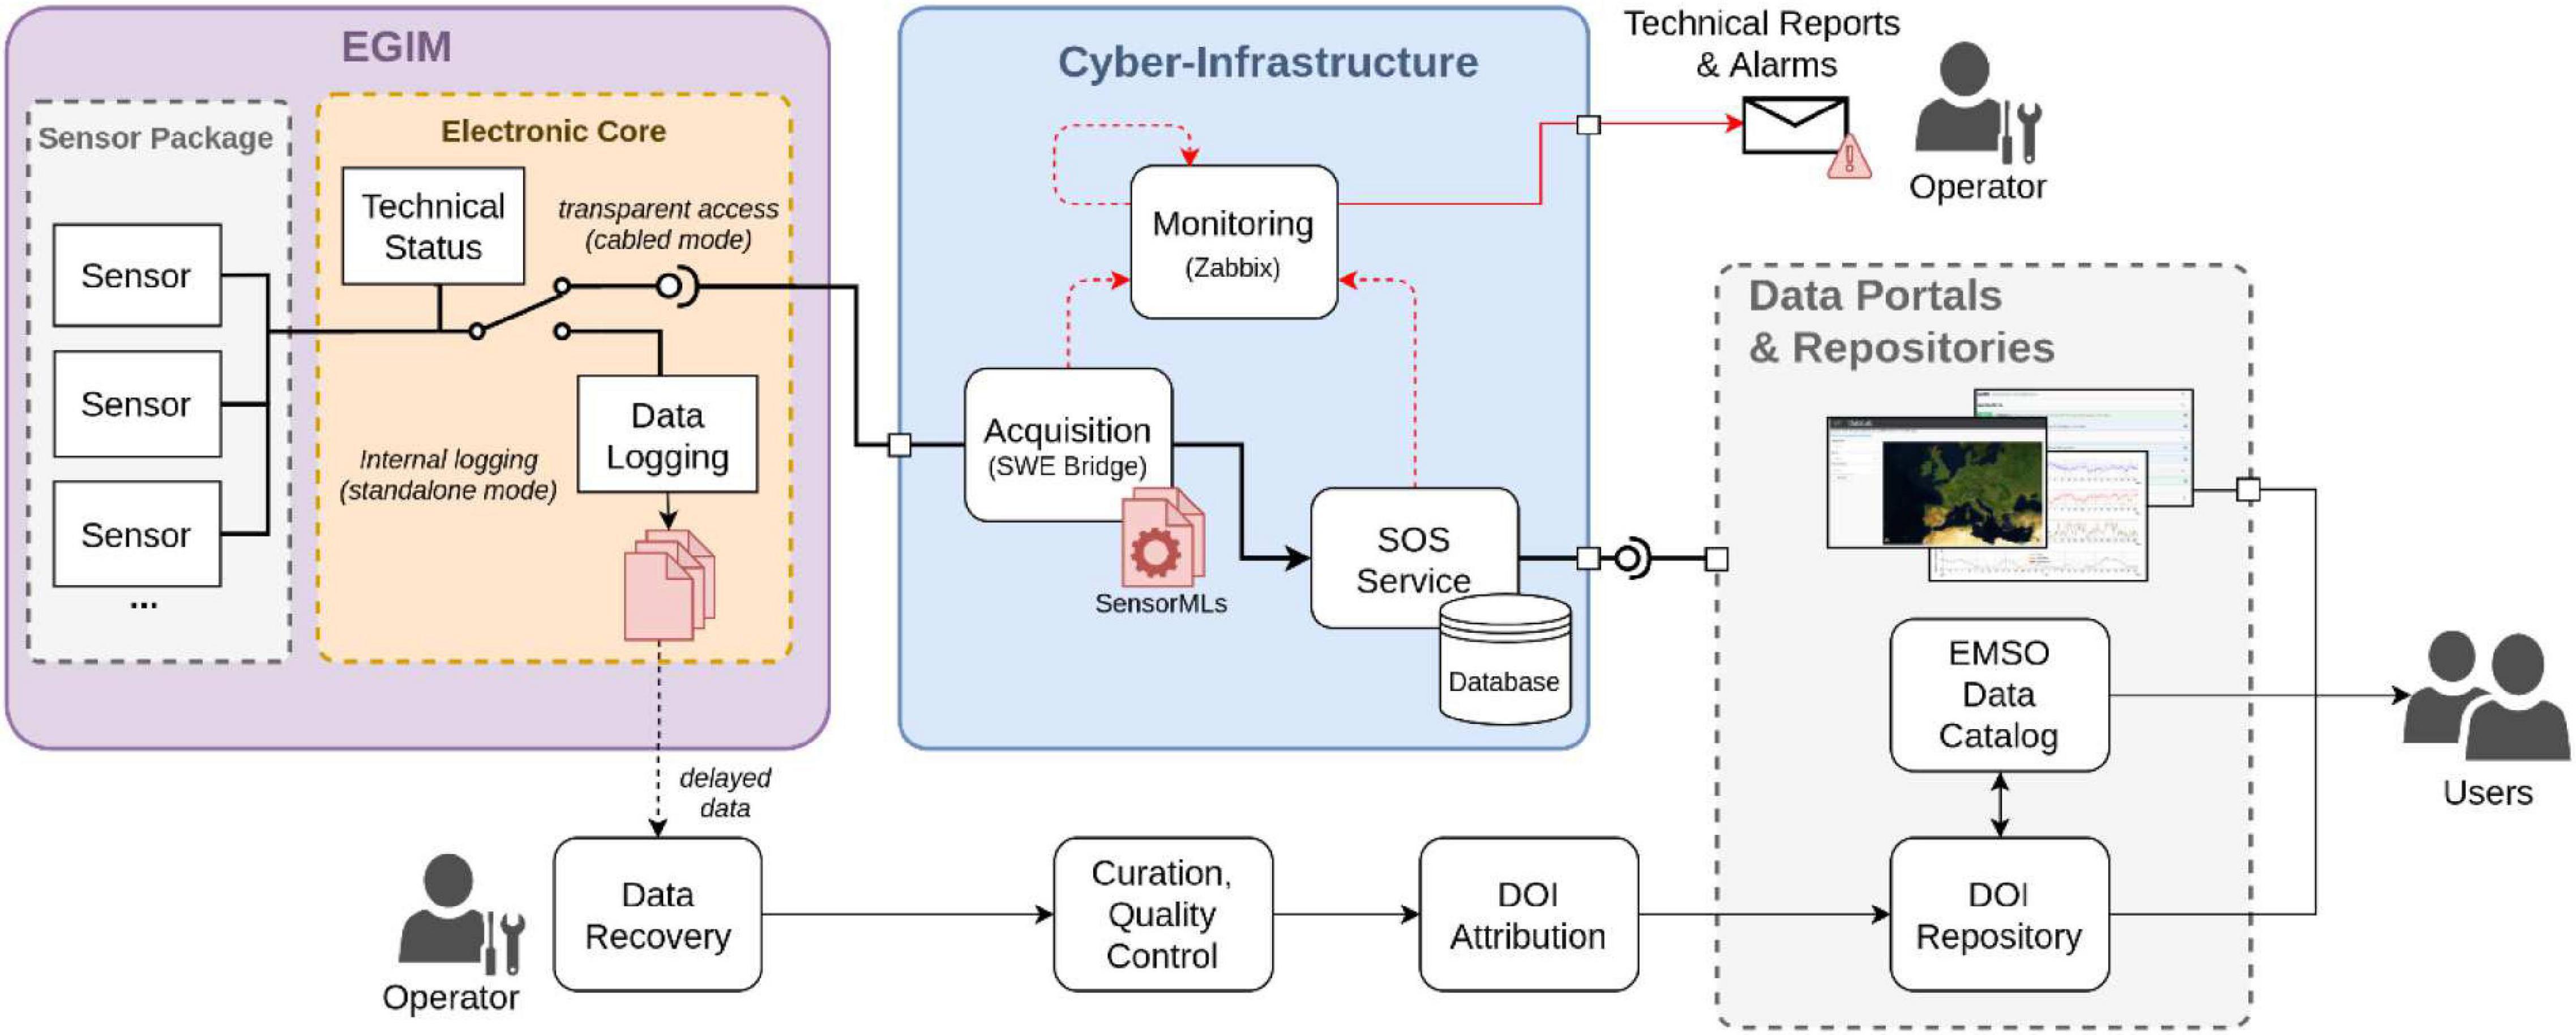
Figure 4. Data flow from the sensor to the end user.
Additionally, a Secure File Transfer Protocol (SFTP) handles the access and transfer of the huge acoustic raw data files (up to tens of gigabytes per day), and Zabbix12 is used to monitor the EGIM and the cyber-infrastructure itself, providing real-time information about the system status and sending alarms when required.
Data Management
EMSO legacy data is distributed over a variety of information systems which differ considerably from each other in terms of technology, formats and interfaces and with respect to their level of support for Findable, Accessible, Interoperable and Reusable (FAIR) data.
Within the project EMSODEV, the EGIM datasets were integrated into the existing infrastructures and published with DOIs in marine scientific data repositories open to the international community for archiving, publishing and long-term availability of data. The datasets are either in SEANOE13 (French) or in PANGAEA14 (German). Following the FAIR Principles, the data is freely available and usable under the terms of the license mentioned on the data set description.
As any EMSO datasets, the EGIM datasets were recorded in EMSO Metadata Catalogue15. The catalog system, mainly based on standards and interfaces defined within the Network of Excellence ESONET4 and the project FixO34, acts as a “data broker” system which is capable of harvesting and extracting metadata from related data archives regardless of their standardization level. It is web based with a searchable metadata index designed to support discovery and use of data by humans as well as machines.
Deployments at Sea
Following intensive laboratory tests which demonstrated the EGIM capability, a series of deployments at sea were used to evaluate the system in the wide variety of configurations (cabled and stand-alone) and environmental conditions (shallow water, deep sea, pelagic, benthic) found at EMSO observatories (see Table 2). The EGIM delivered useful data across a range of scientific themes, highlighting its value for specific science questions.
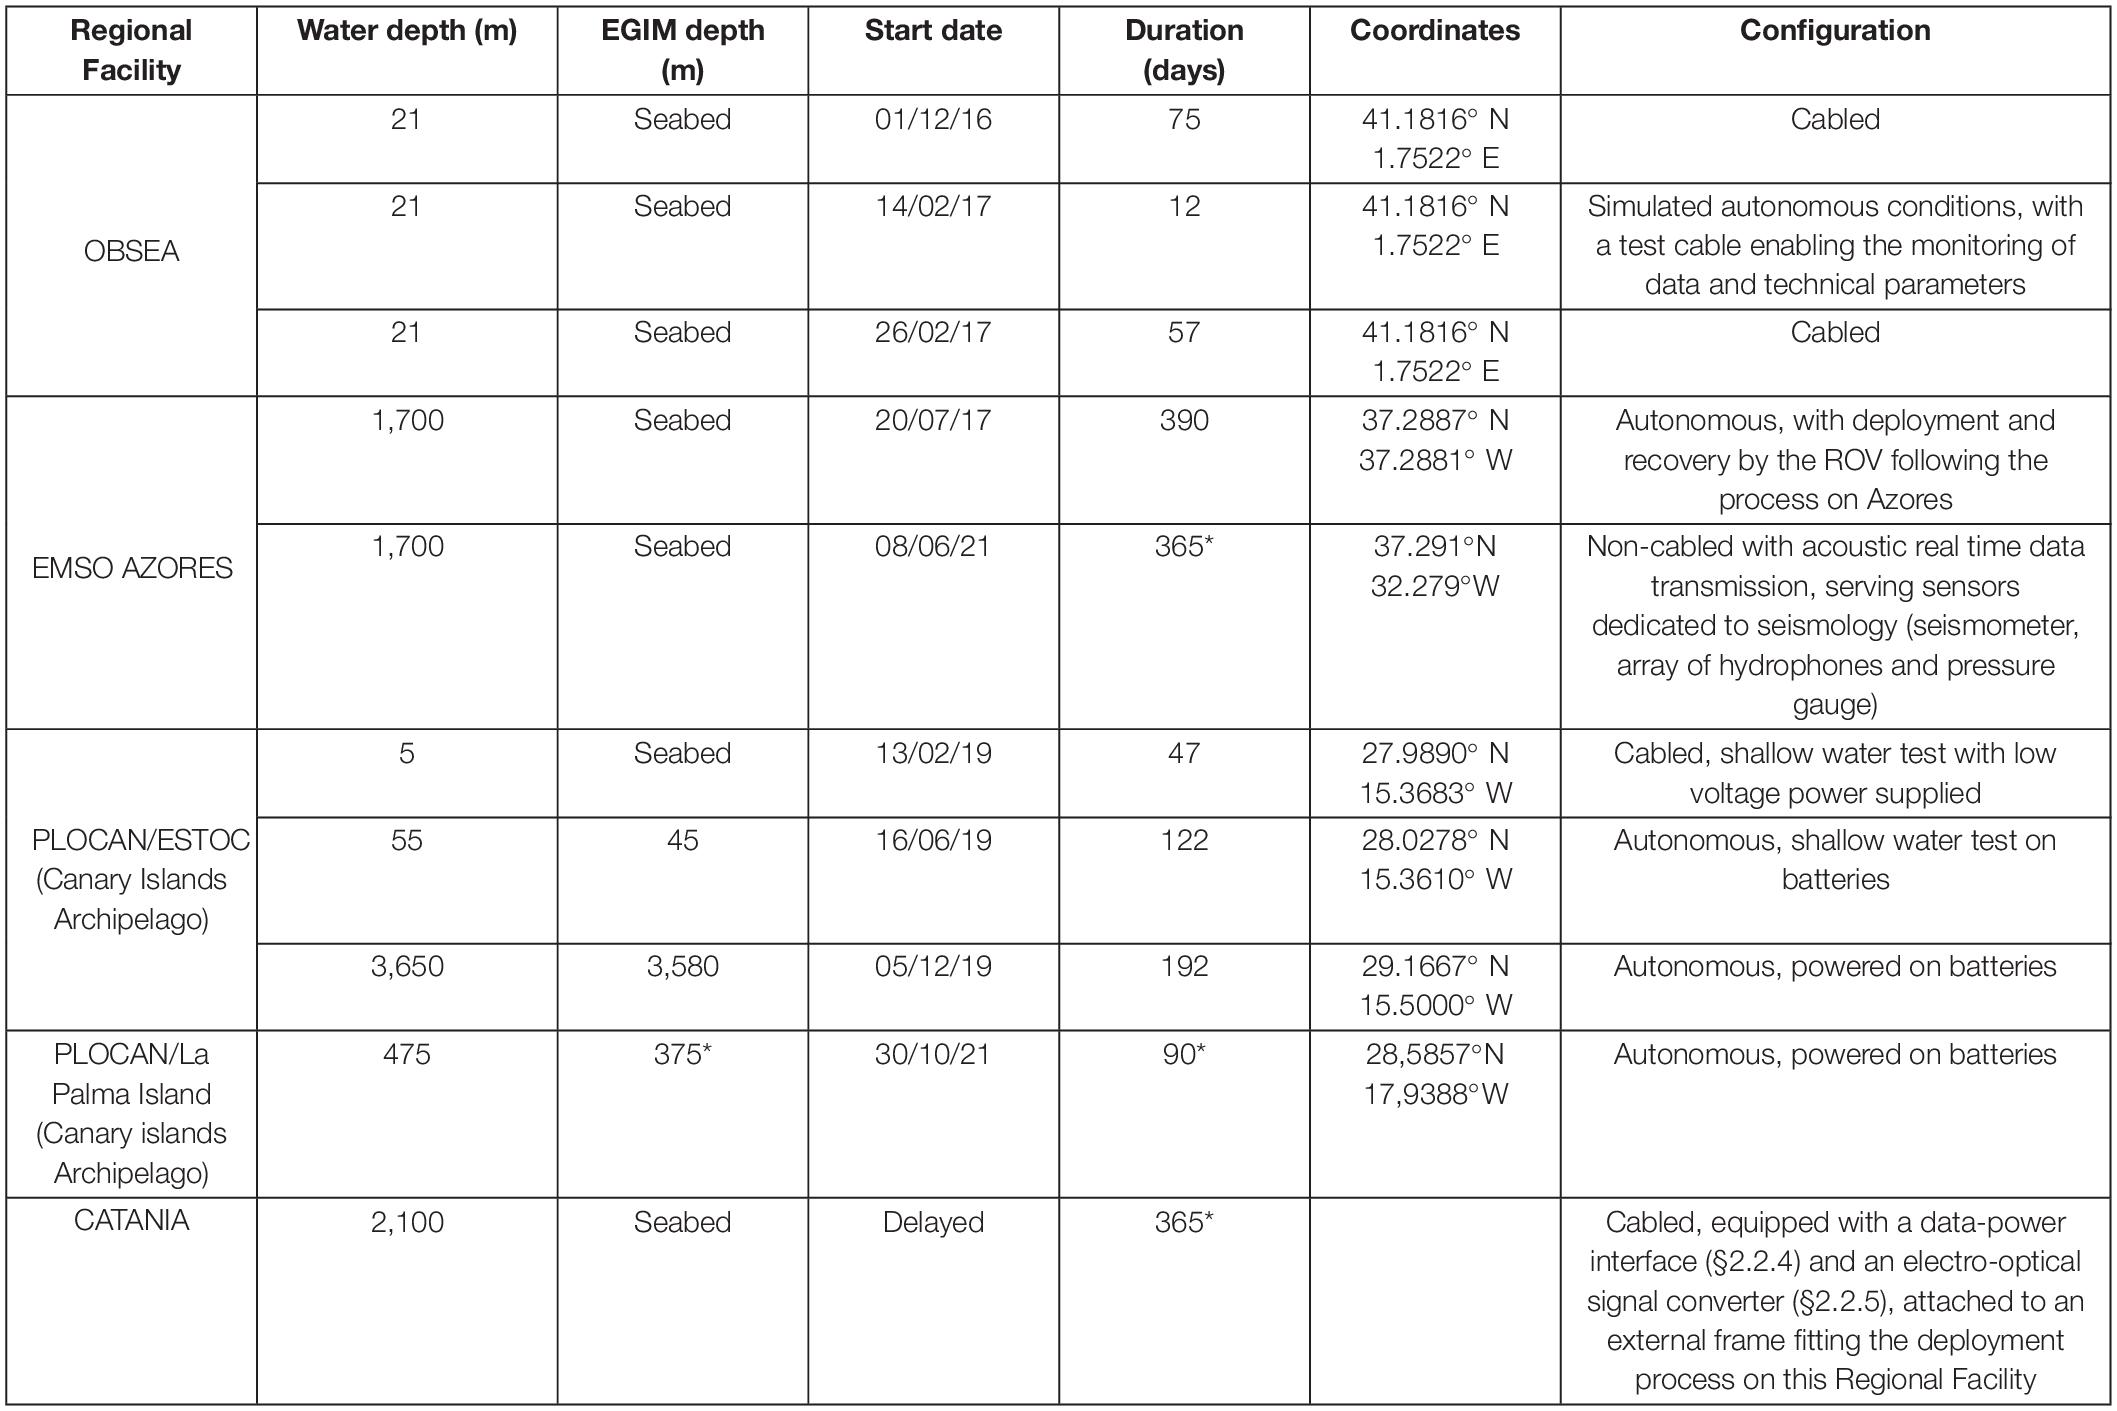
Table 2. EGIM deployments up to date, with information about the EGIM setup; See general description in Figure 2, §3.1.1 for autonomous or non-cabled modes and §3.1.2 for cabled mode; (*) duration and depth expected for present or coming deployments.
Correlation of Fish Activity and Biologically Relevant Oceanographic Variables at OBSEA
The EGIM was connected to the OBSEA cabled observatory16, 4 km off Vilanova i la Geltrú (Spain) within Coll i Miralpeix Marine Reserve and Natura 2000 protected area (Figure 5). OBSEA focuses on scientific and technological experiments and time series studies which identify environmental influences on biodiversity (Aguzzi et al., 2013), upwelling phenomenon studies (Cusi et al., 2017) and development of new standards and protocols for marine sensor networks (del Rio et al., 2018; Martinez et al., 2021).
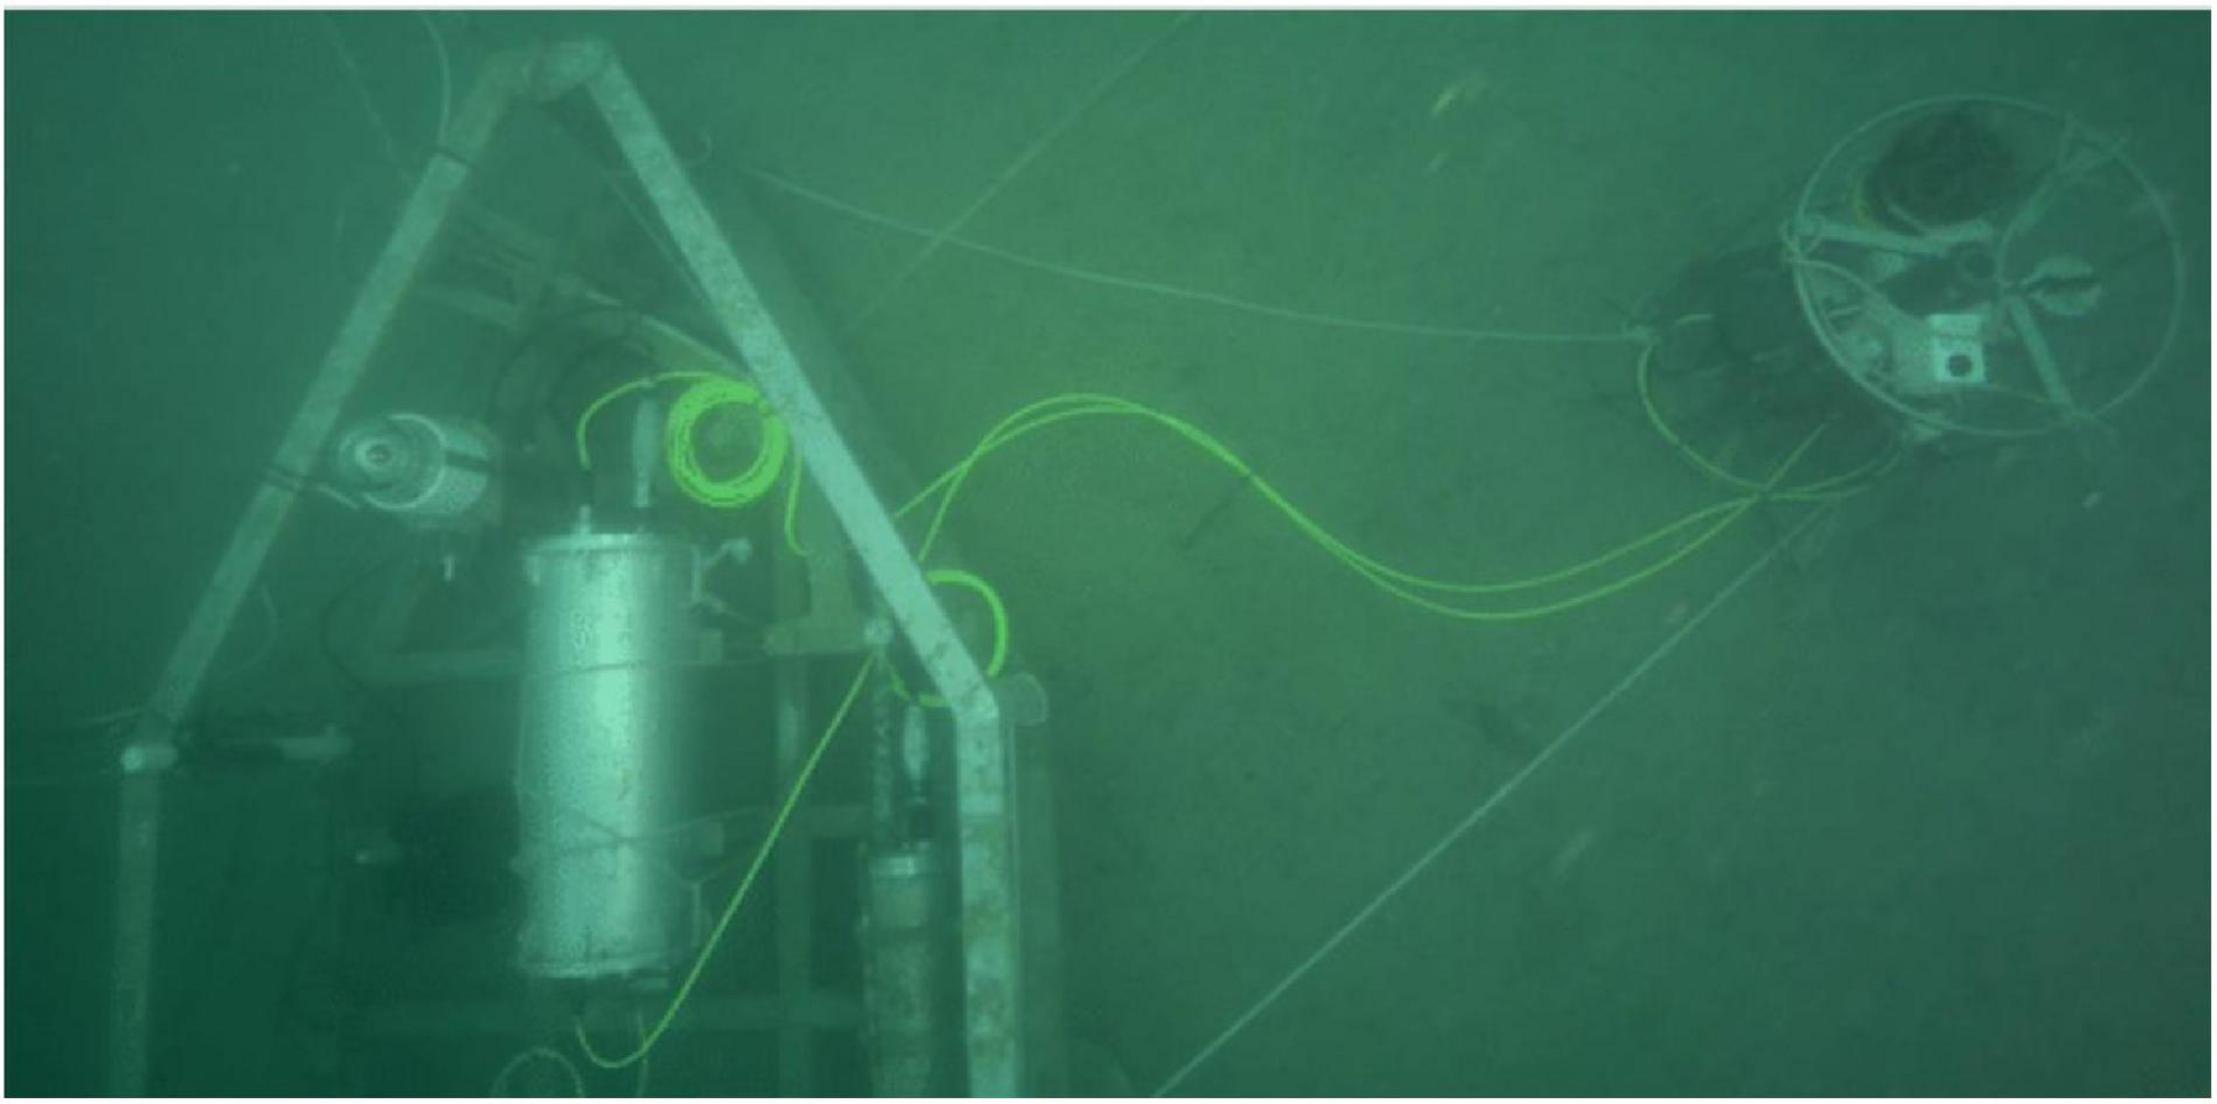
Figure 5. The EGIM (right) connected to the OBSEA platform.
Beyond the tests in a coastal environment, the EGIM deployment at the OBSEA led to establishing a methodology to correlate fish activity and biologically relevant oceanographic variables. The EGIM provided data for salinity, temperature, sound velocity, water depth and dissolved oxygen (Toma et al., 2017) and two underwater digital cameras (a camera rotating over 360° and, five meters apart, a fixed camera) provided the fish activity observations around an artificial reef (del Rio et al., 2021).
Images were recorded every 30 min, for 3 months and data from days when divers visited the site, modifying the fish behavior, were excluded. To obtain a comprehensive richness list, all the individuals visible in the images were identified and classified to the lowest taxonomic level possible, using the latest scientific nomenclature (i.e., FISHBase17), deriving time series counts (Aguzzi et al., 2020a,b). Concomitantly, time series for all the environmental data were compiled by selecting and extracting only readings contemporary to the timing of the images.
Then, a waveform analysis was conducted (with 24-h segments of 30 min and averaged fluctuation calculated over 24-h) to assess the phase of the species activity rhythms (period of the day when the results of waveforms are above the MESOR, Midlines Estimating Statistic of Rhythm estimated by re-averaging all the waveforms values), separately for each species, for the total of counted fishes (i.e., the species assemblage) and the unclassified individuals, as well as for each oceanographic variable, in terms of peak timing.
An integrated chart of waveform phases (Aguzzi et al., 2020a) was used to determine the periods when the environmental variables and the activity of the studied species displayed significant increases (i.e., temporal coherence of rhythms and cycles as proxy for cause-effect relationships).
The integrated analysis (Figure 6) highlighted that fish which do not follow a general behavioral pattern in relation to the photoperiod likewise do not follow the general environmental ranges. The majority of species increase their presence during daytime, anticipating the increment in the fluctuation status for some of the recorded environmental variables (e.g., salinity and temperature, which progressively increment at the photophase, peaking at late day, for solar heating action and dropping at night).
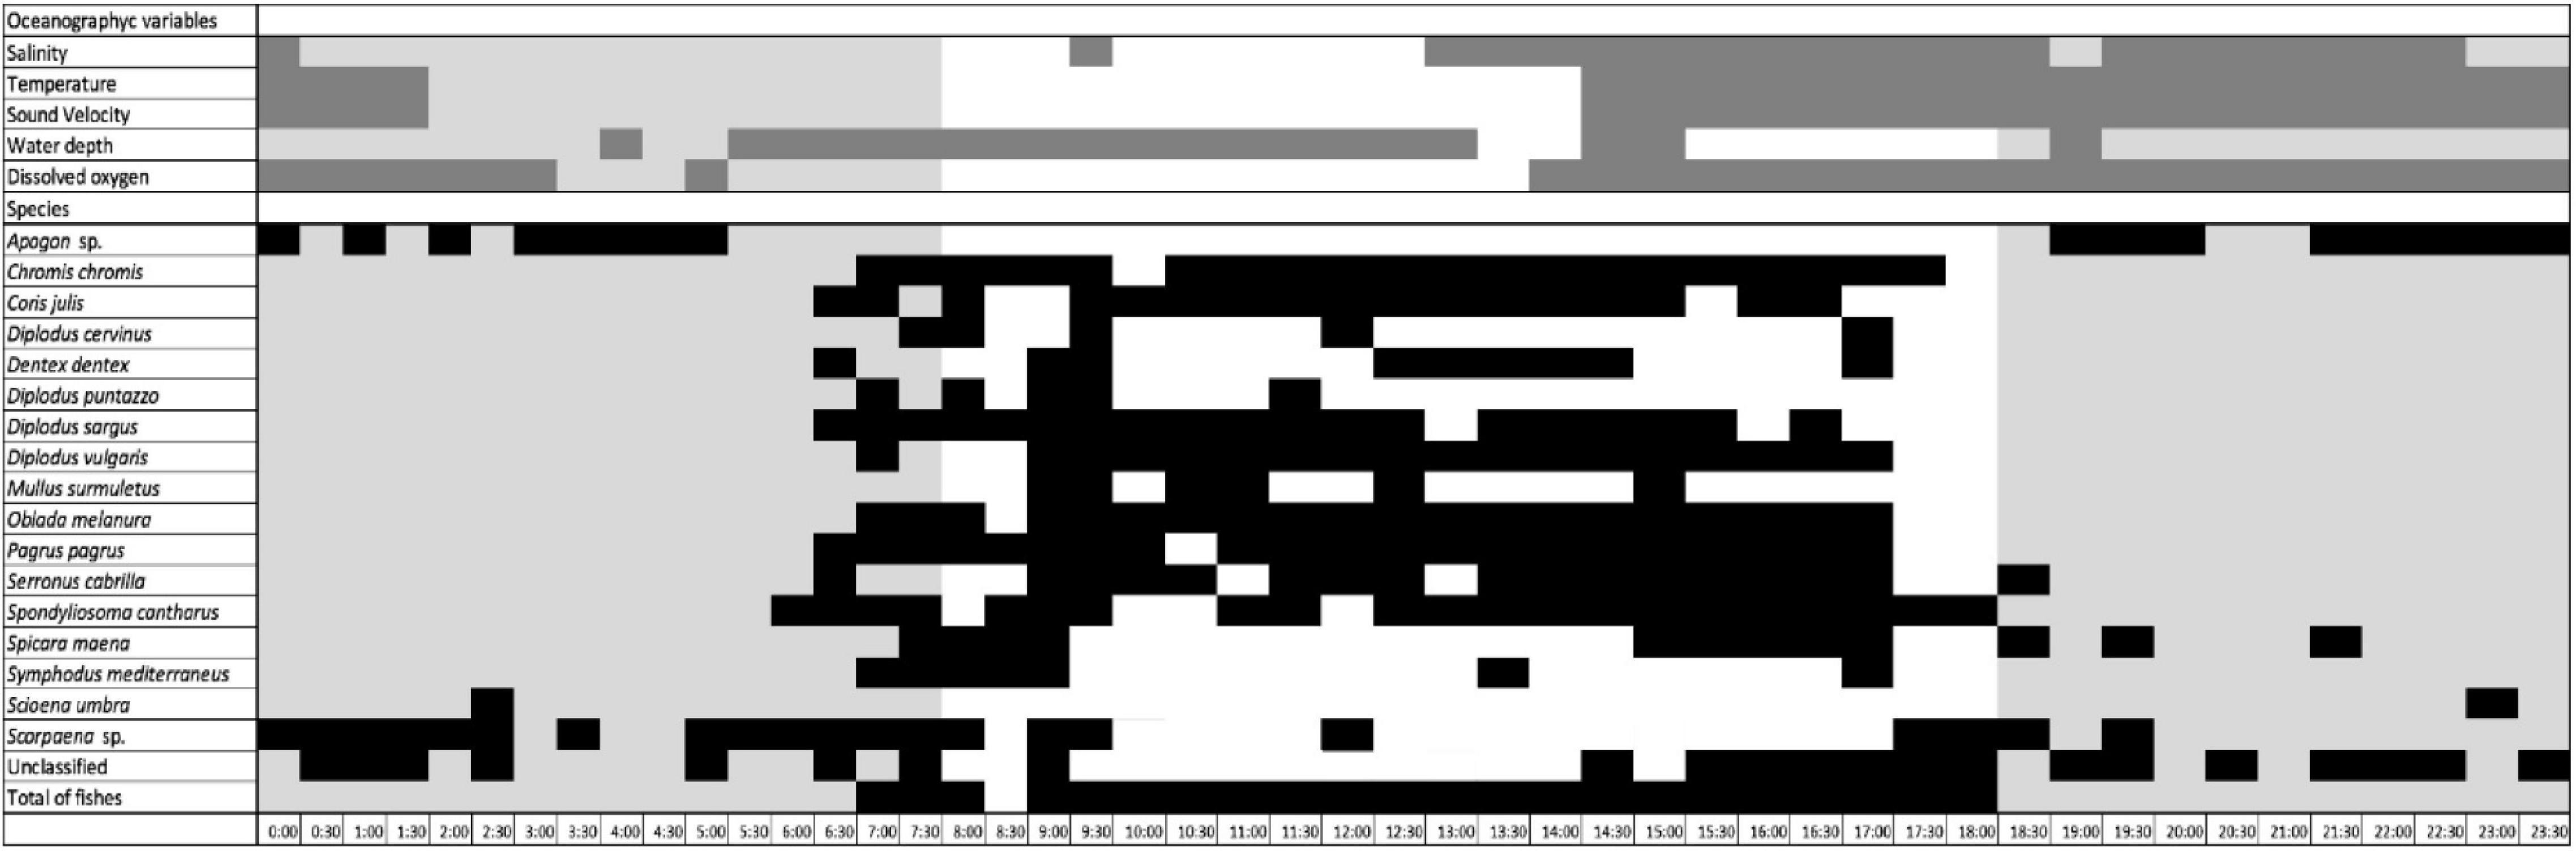
Figure 6. Integrated chart of significant daily increases (mean values above the MESOR in each waveform plot) for the 5 biologically relevant oceanographic variables and visual counts of the 19 taxa, unclassified and total fish. Dark gray horizontal bars report values above the MESORs for the oceanographic variables, black horizontal are used for visual counts and light gray boxes show the duration of night hours.
EGIM deployment at OBSEA led to the setting of a new methodology to correlate fish diurnal/nocturnal behavior and environmental variables. Further data analysis will be conducted adding new entries such as trophic relationships (e.g., predators-prey relationships) and primary productivity (e.g., plankton concentration). Longer experiments are now required to confront the results with stronger variation of the environmental parameters and achieve conclusions about seasonality.
Dispersion of Hydrothermal Vent Fluids and Particles in the Near Seafloor Seawater on EMSO-Azores
EMSO-Azores is situated on the mid-Atlantic Ridge, at the Lucky Strike active hydrothermal vent field18 (Ondréas et al., 2009) at about 1,700 m water depth, a site designated as a Marine Protected Area in the OSPAR Network in 2007. Initiated in 2010, EMSO-Azores is one of the few long-term monitoring sites for hydrothermal vent fields in the world (Glover et al., 2010; Cannat et al., 2011) and contributes to the understanding of the responses of these systems to environmental forcing.
The observatory supports sensors connected to two seabed stations which provide bi-directional acoustic communication with a surface buoy and the shore. SeaMon East is the station positioned at the base of the largest vent site of the field, Tour Eiffel. It records temperature and nephelometry and provides power to the TEMPO ecological module, placed near a diffuse venting area, 10 m to the north. TEMPO monitors the evolution of the hydrothermal fauna with a camera and measures several environmental variables (temperature, dissolved oxygen and iron concentrations).
The EGIM was deployed near the Tour Eiffel vent site, 25 m to the southwest of TEMPO and a TCM3 Lowell Instrument autonomous bottom current meter was deployed another 15 m to the south (Figure 7). Remotely Operated Vehicle (ROV) operations, including Wi-Fi underwater connections, were carried out a few days after deployment to check and complete the installation (Sarradin and Cannat, 2017). The EGIM was recovered during the MOMARSAT 2018 cruise (Cannat, 2018). Data was collected from all the sensors. Duration and frequencies of data acquisitions were defined to fit the power and data storage on board the EGIM.
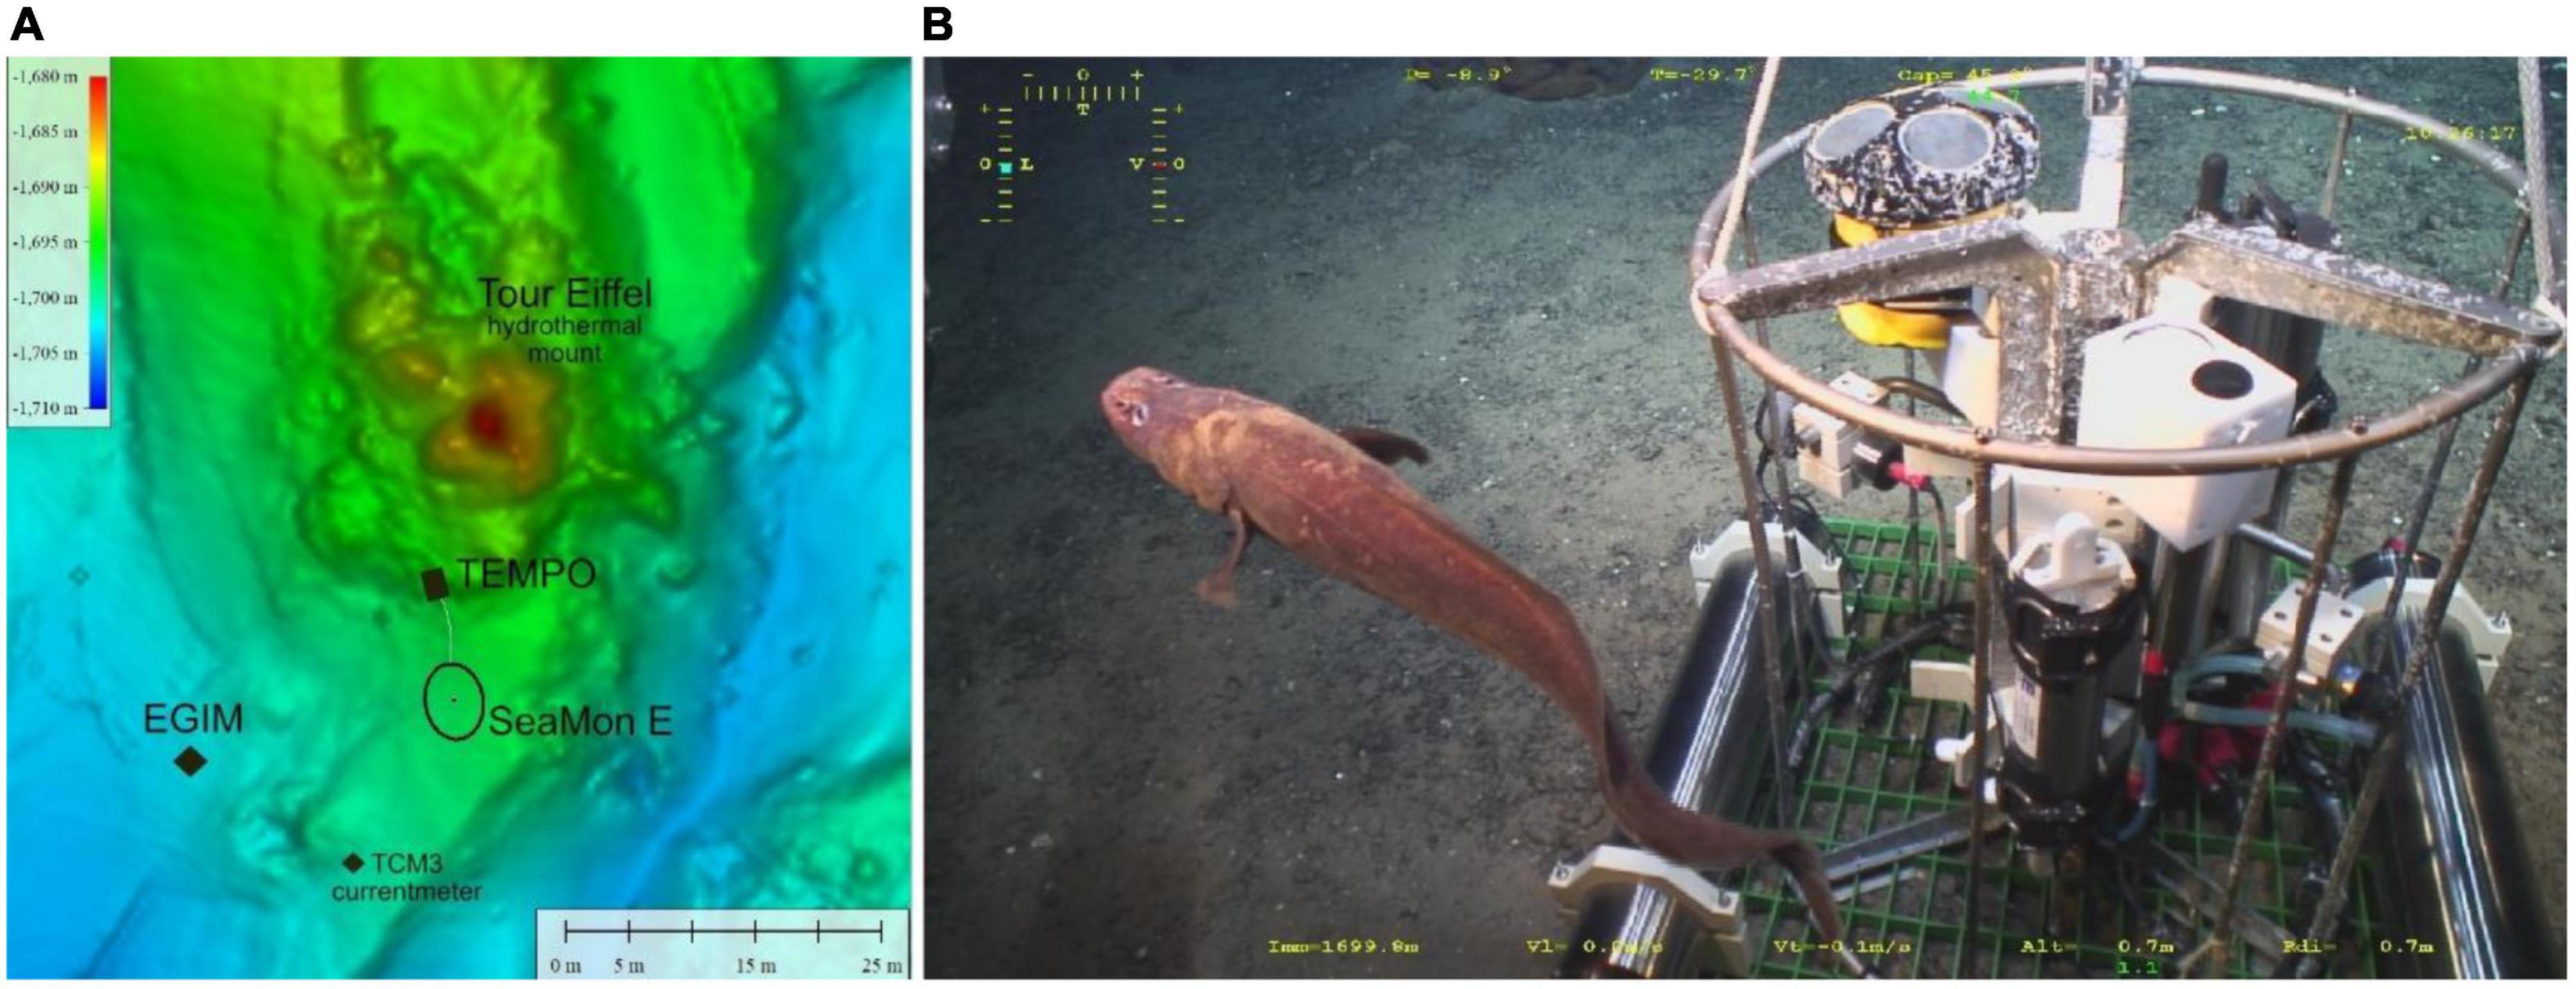
Figure 7. (A) Map of the Tour Eiffel area at Lucky Strike (mid-Atlantic ridge) showing the location of the EGIM and the components of the EMSO-Azores observatory; (B) the EGIM.
On EMSO-Azores, the EGIM provided data (Sarradin et al., 2018a,b, c, d) valuable to the local hydrodynamic variability monitoring, complementing the data obtained by the other components of the observatory (Cannat et al., 2018; Laes et al., 2019; Sarradin et al., 2019) and improving the assessment of the dispersion of hydrothermal vent fluids and particles in the near seafloor seawater. Large variations in temperature and chemistry within venting areas can result from several mechanisms occurring in the shallow sub-seafloor (Cooper et al., 2000; Scheirer et al., 2006), but also from modulations by tides and currents (Tivey et al., 2002; Barreyre et al., 2014) and smaller-scale near-seafloor hydrothermal circulations (Schultz and Elderfield, 1997). Understanding these mechanisms requires the long-term monitoring of venting activity, but also of background seawater at reference points to discriminate between regional changes in water masses and local variation in venting activity (e.g., opening and closing of vents, sub-seafloor local processes).
The EGIM nephelometer measured low particle loads, just a little above the background dark value measured during calibration of the sensor (i.e., 48 NTU). Levels of turbidity were higher and more variable at SeaMon East, located on higher grounds and closer to Tour Eiffel vents, with peaks recorded in October, December, January, February and March (Figure 8A). Some of these peaks appear to match an intensification of venting activity in the nearby diffusion area, revealed by sharp increases in temperature and decreases in oxygen measured by the TEMPO (Figure 8C). Most variations, however, did not correspond with variations near the TEMPO vent indicating that SeaMon East also received particle loads from the main smokers located further up and to the north on the Tour Eiffel sulfide mount (Figure 8A). All nephelometry highs recorded at Seamon East, are tidally modulated and coincide with current reversion, with higher particle loads occurring at times of southern-directed currents (10B-C) which would transport material from the edifice toward SeaMon East. The EGIM data occasionally reveals small amplitude peaks (5 NTU; Figure 8B detail October) which clearly coincide with the larger amplitude variations recorded at SeaMon East (20 NTU or more) and are similarly correlated with tidal variations in current velocity and direction.
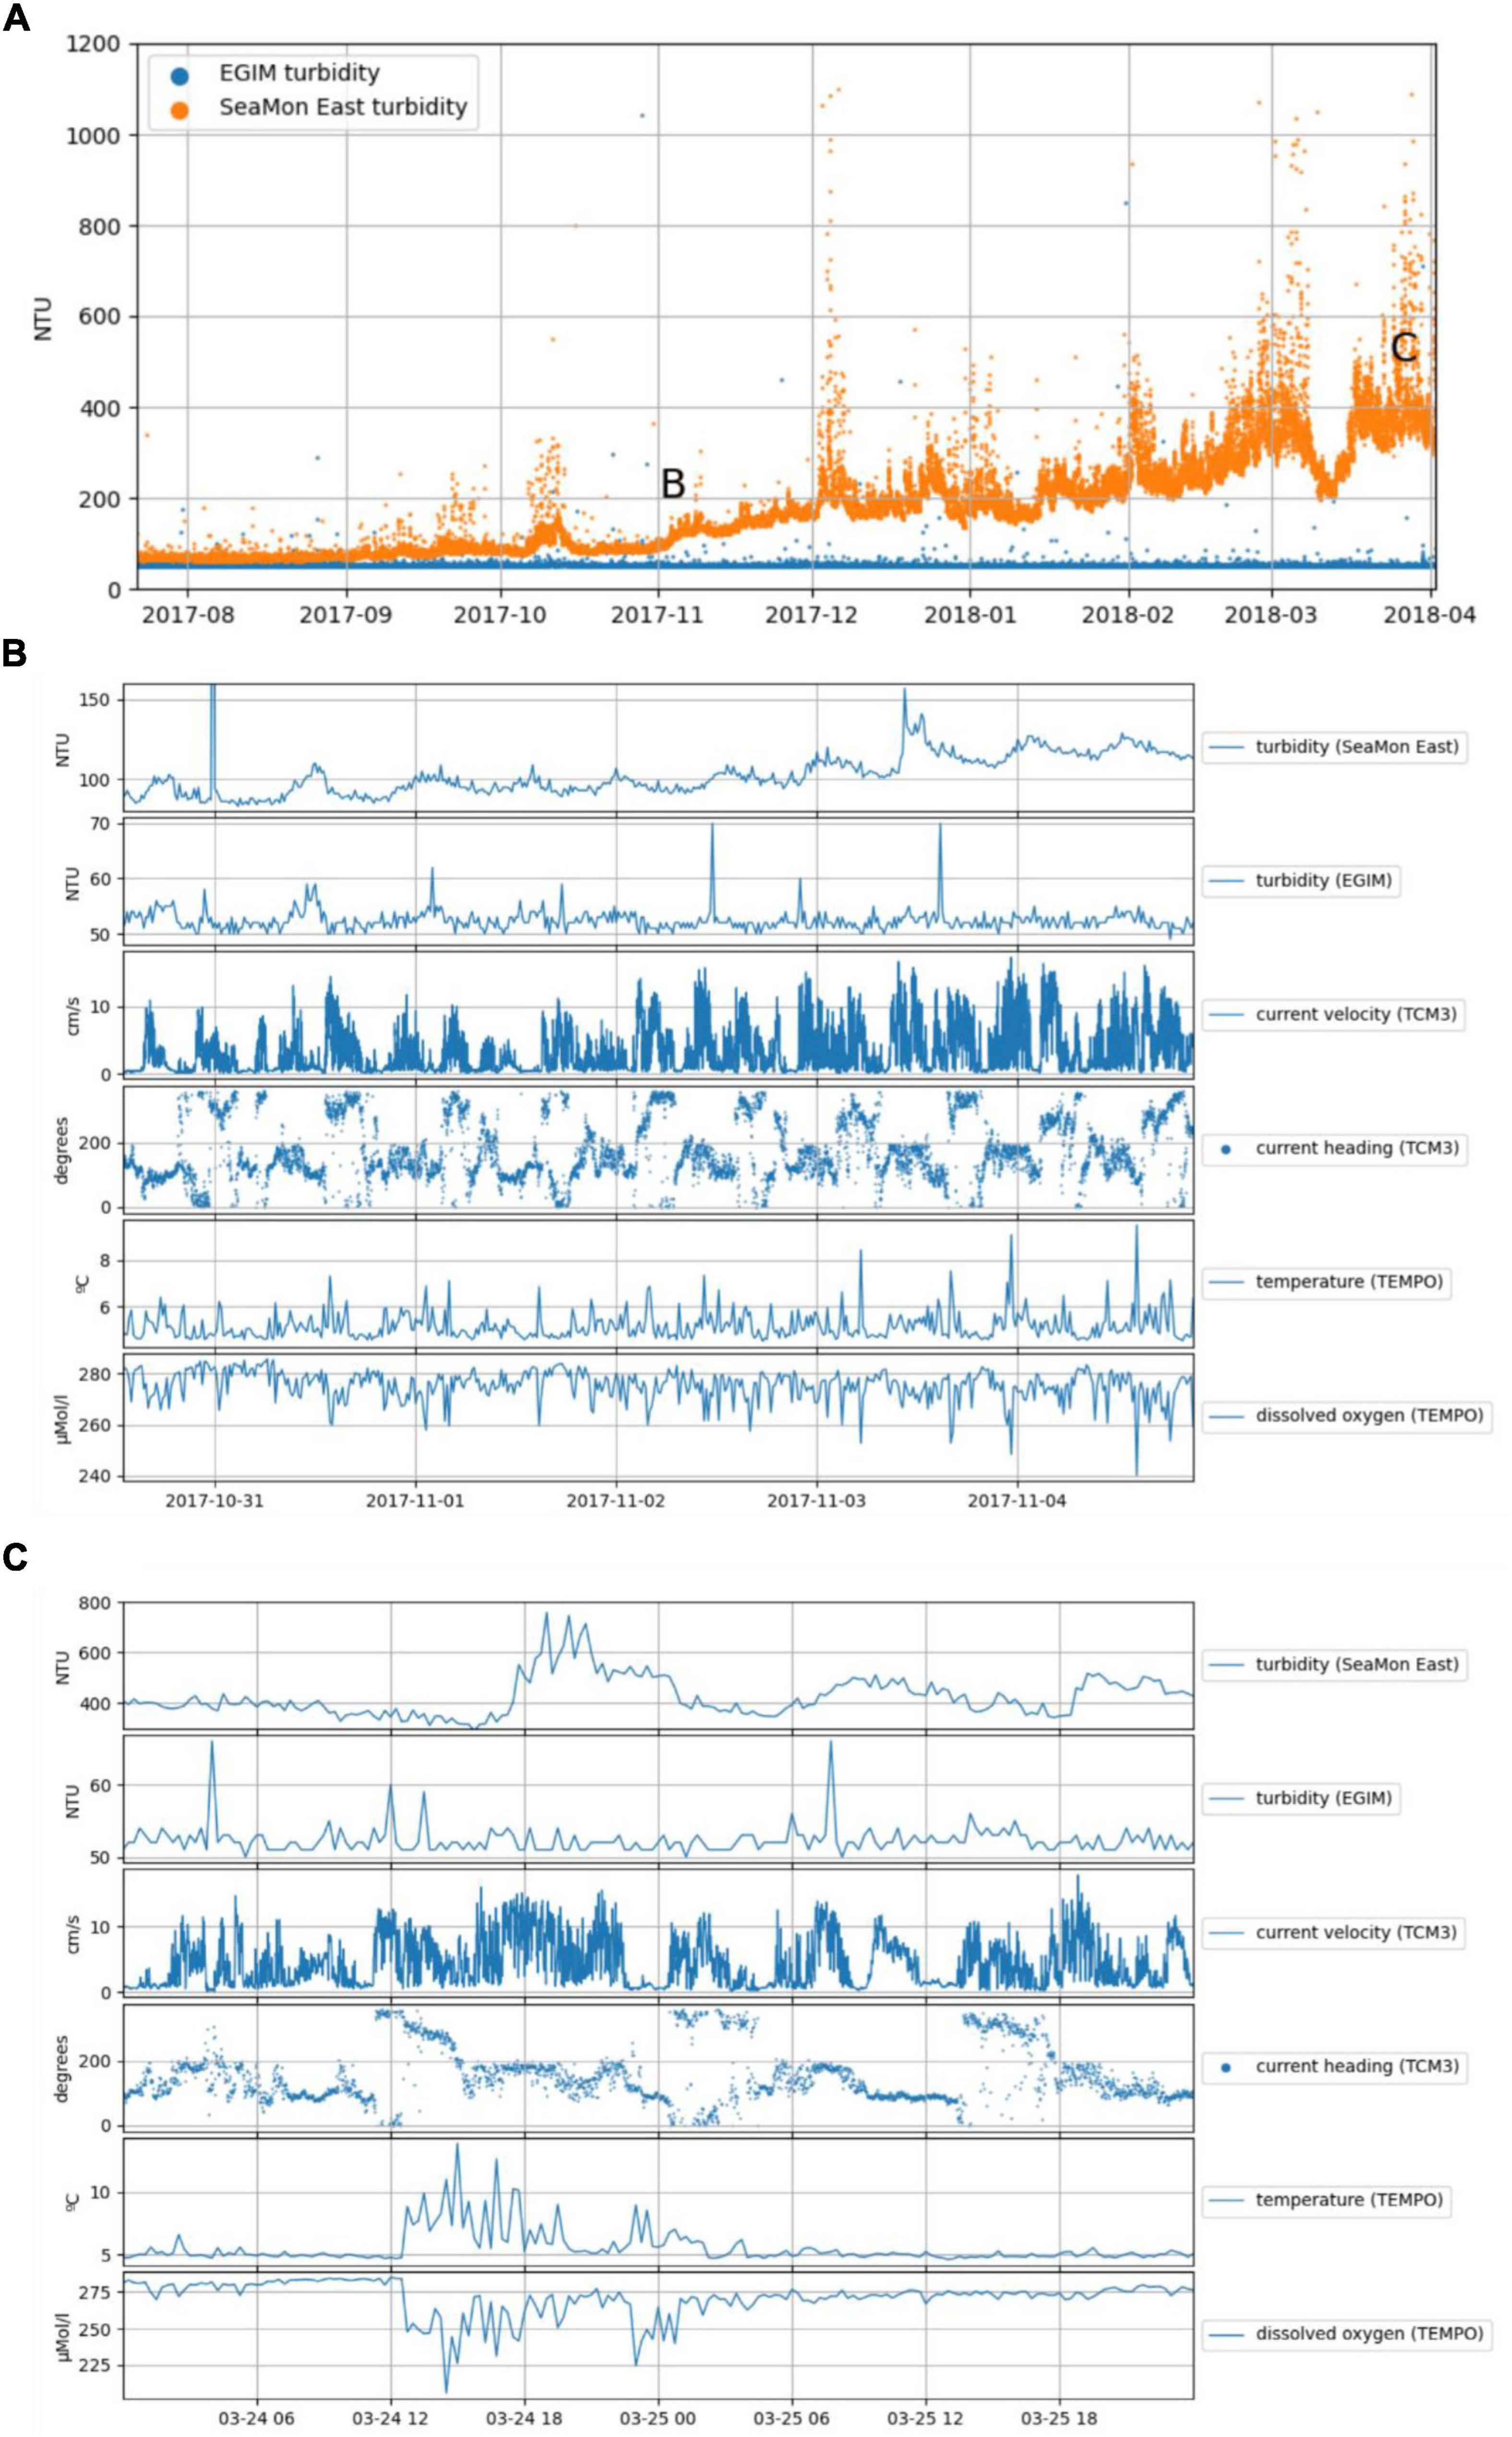
Figure 8. (A) Evolution of turbidity measured by the nephelometers on the EGIM (blue) and Seamon East (orange) from 20 July 2017 to 4 April 2018. Details from the periods designated in panel (A) are shown in (B,C). In (B) turbidity, currents, temperature and dissolved oxygen concentration from 30 October 2017 12:00 to 4 November 2018 18:00. In (C) turbidity, currents, temperature and dissolved oxygen concentration from 24 to 26 March 2018. Turbidity was measured by nephelometers deployed on the EGIM and the Seamon East. Current velocity and heading were recorded by the autonomous current meter. Temperature and dissolved oxygen concentration are from TEMPO (see Figure 7A for locations).
Seawater temperatures measured by the EGIM and by SeaMon East are similar over the entire deployment period (i.e., 4–5°C). The dispersion radius of vent particles is therefore significantly larger than the effect that vent plumes might have on seawater temperature, which confirms the key role of currents on the near vent dispersion of hydrothermal particles (Girard et al., 2020).
This example shows how the EGIM, measuring surrounding background oceanic conditions, can complement the array of instruments and bring valuable information on the dispersion of vent particulate matter, a key parameter for the distribution of hydrothermal habitats (Girard et al., 2020).
Analysis of Acoustic Recordings From EMSO-Azores
The 3 months of acoustic data recorded by the EGIM on EMSO-Azores (duration was limited to match the energy available on the system; Sarradin et al., 2018e) were processed to search for acoustic events of interest under the LIDO19 (Listening to the Deep-Ocean Environment) framework (André et al., 2011). As the data was recorded at a sampling rate of 4 kHz the analysis was limited to low frequency events, such as fish sounds or the lowest part of cetacean biosonar. Impulsive sounds, such as biosonar, were detected in a band between 500 and 2,000 Hz and short tonal sounds, such as whistles, with two detectors operating between 100–300 and 500–2,500 Hz. At this detection level, no distinction was made between biological sounds or self-noise, shipping sounds or other events. The detections serve to quickly browse over the dataset in order to find moments of interest. In addition to various animal sounds, some seismic events were identified, using the third-octave band sound pressure level measurements. Some results of the detections are shown below with links to access the database; Figure 9 provides examples of biological impulse and short tonal signals and examples of other low frequency biological and natural.
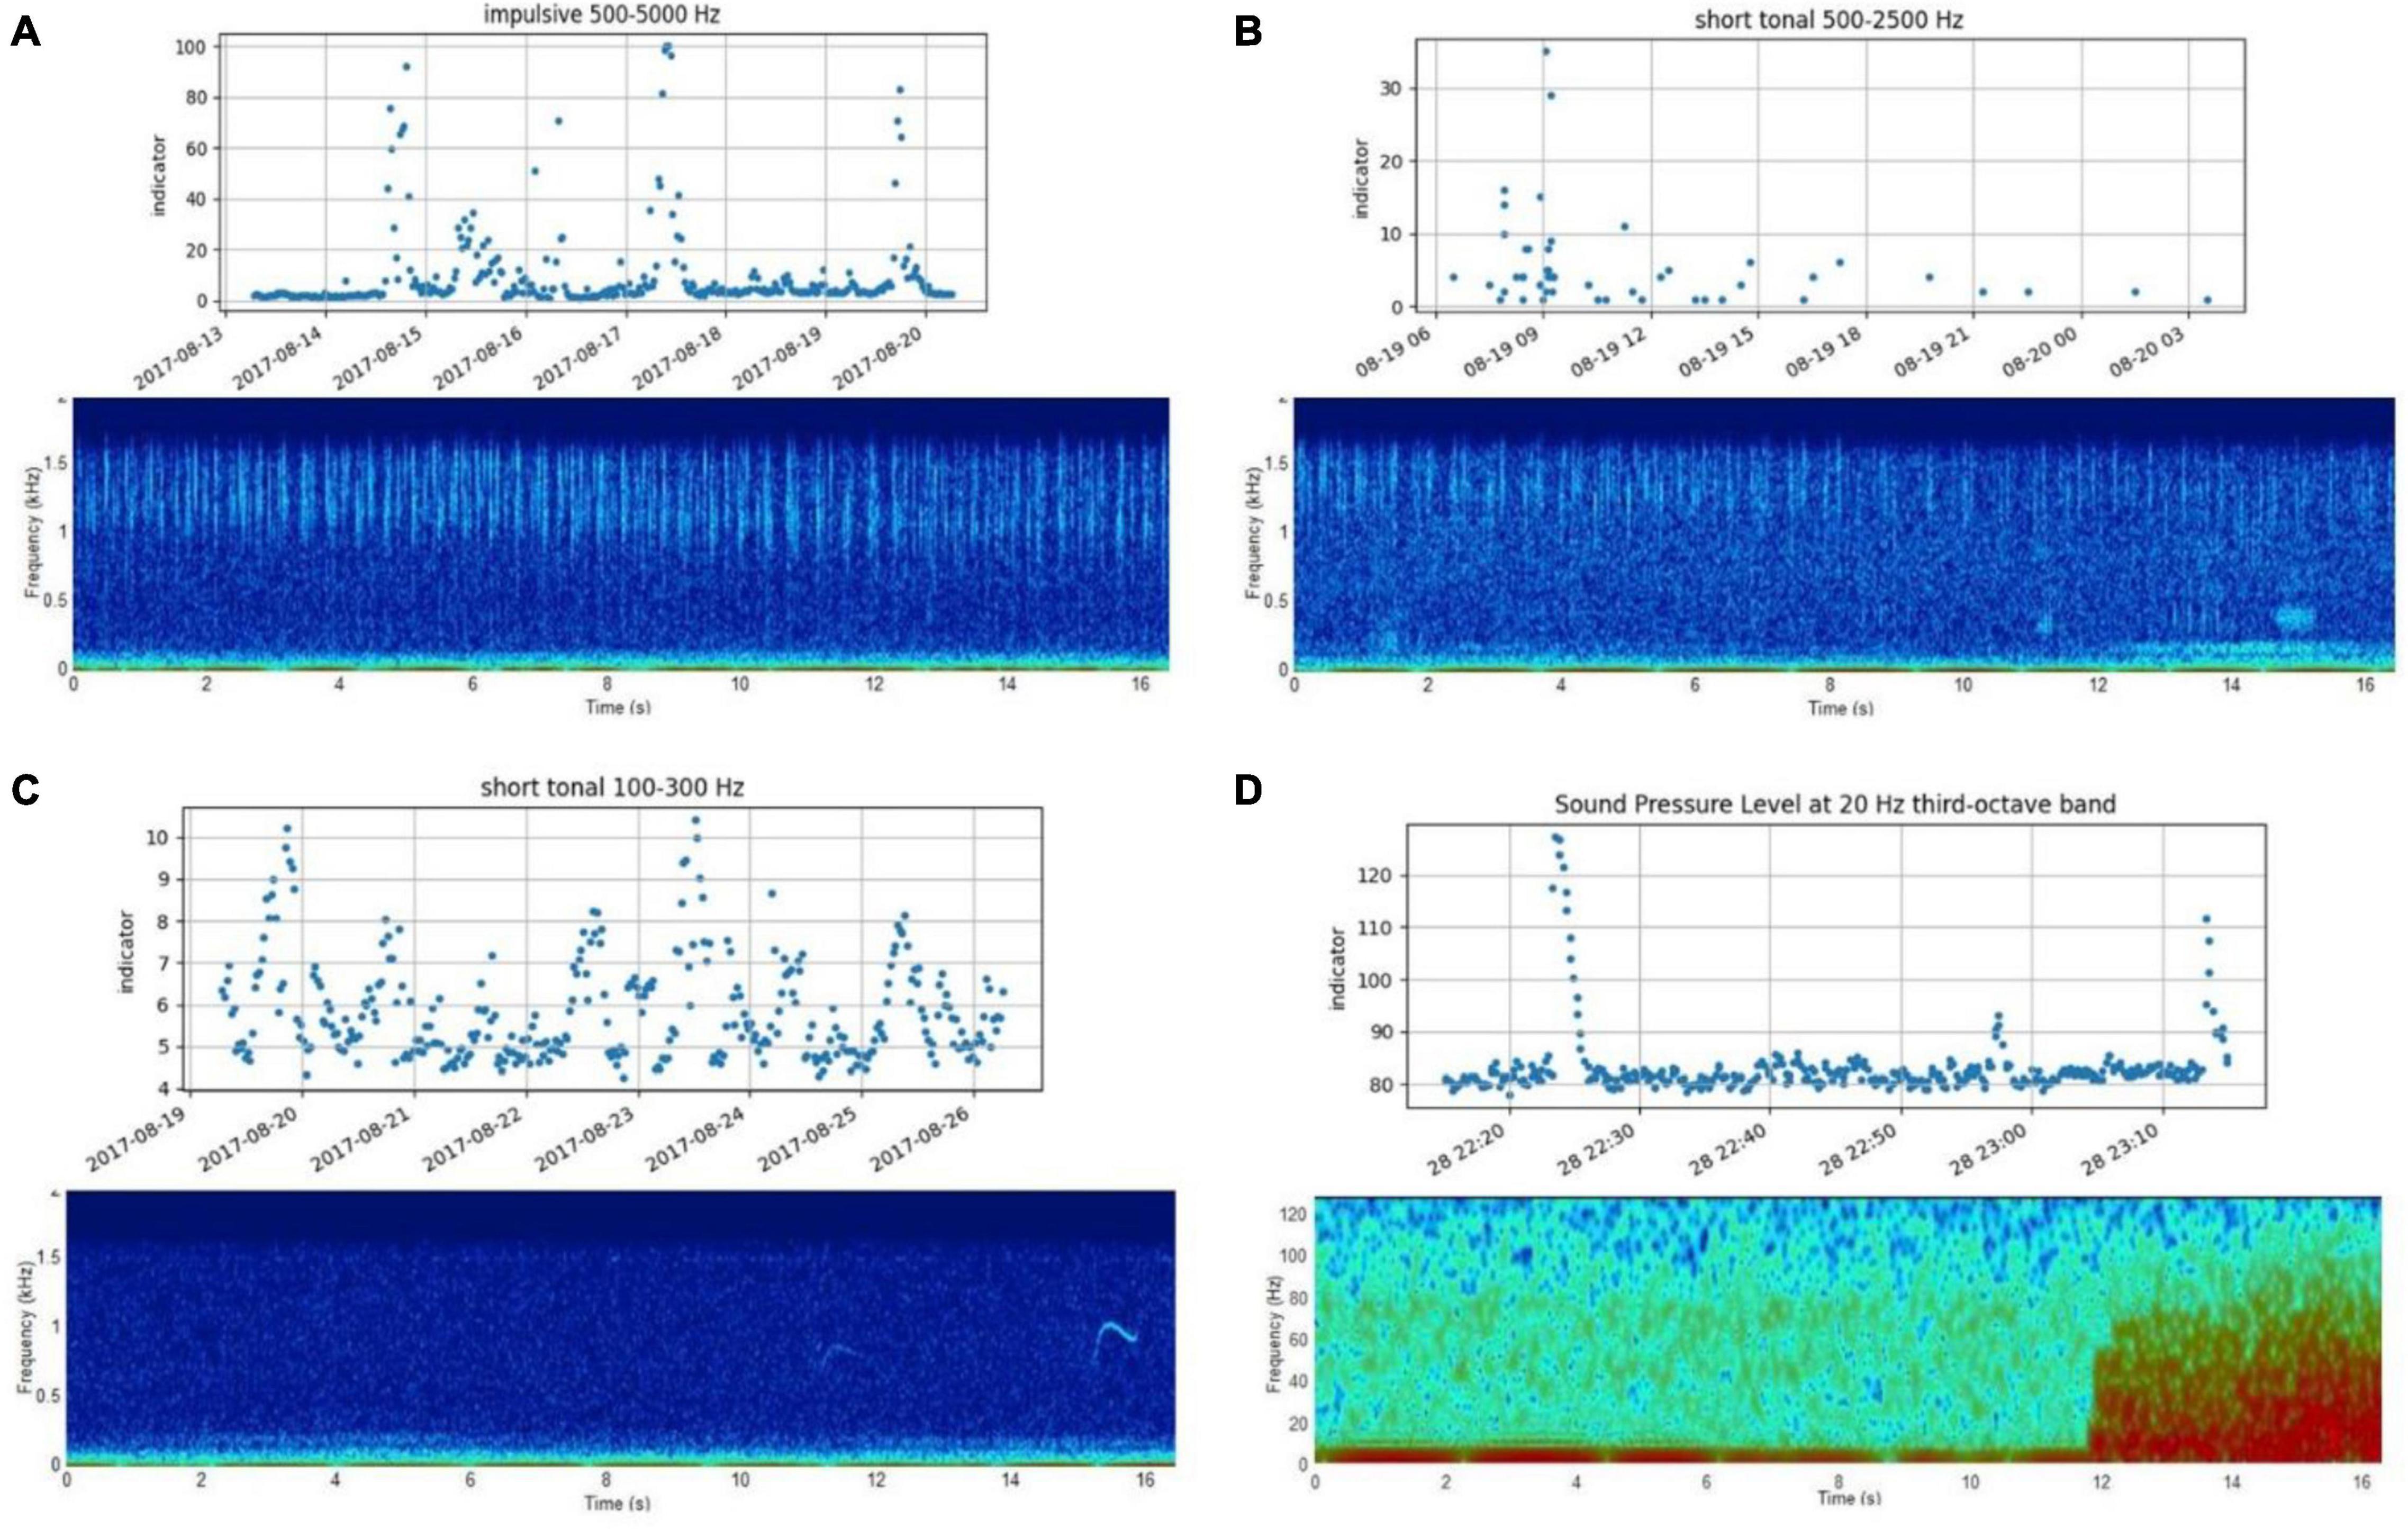
Figure 9. Examples of acoustic events, each panel in this figure shows first in the dotted graphic the output of the data processing over almost 16.3 s segments with one dot per segment, for a particular detector or for example the sound level in a particular band. The second image in each panel is a spectrogram which shows a particular segment of interest (high detector value or high sound level): (A) the output of the impulse detector between 500 and 5,000 Hz and in the spectrogram signals which might be the lower part of sperm whale biosonar Play example A: (http://lido.listentothedeep.com/acoustics/index2.php? web=dataanalysis&rebuild&ts=1502604900&spp=0&width=0&time_unit=days&time_value=7&draw=67073:16843265:0:0-&grouping=none&metric_id=1 &trend=0&spectrogram_timestamp=1502961658&spectrogram_platform=67073&spectrogram_segment=0&spec_id=1&overlay=1). (B) The output of the short tonal detector between 500 and 2,500 Hz which picked up various whistle-like signals Play example B: (http://lido.listentothedeep.com/acoustics/index2.php? web=dataanalysis&rebuild&ts=1503123300&spp=0&width=0&time_unit=days&time_value=1&draw=67073:16843012:0:0-&grouping= none&metric_id=1&trend=0&spectrogram_timestamp=1503133395&spectrogram_platform=67073&spectrogram_segment=1540559007&spec_id=1&overlay=1). (C) The output of a low frequency short tonal detector with a spectrogram showing at the bottom right-side croaker fish sounds Play example C: http://lido.listentothedeep.com/acoustics/soundlibrary/listenrt.php?idSeg=1540560833&idLoc=67073&idRun=176211&ts=1503163122&spec_id=3&class_id=16843025&data_id=0&tstart=1503159522&tend=1503249658. (D) Sound levels in the third-octave centered on 20 Hz clearly indicating an event of interest and a zoomed spectrogram at the start of a seismic event Play example D: http://lido.listentothedeep.com/acoustics/soundlibrary/listenrt.php?idSeg=1540774324&idLoc=67073&idRun=389685&ts=1506637399&spec_id=4&class_id=3492806916&data_id=0&tstart=1506633799&tend=1506641008.
A large number of marine mammal species can be found around the Azores Islands (Silva et al., 2003), making it an important area for conservation and monitoring. The EU focus on underwater noise through the Marine Strategy Framework Directive (Van der Graaf et al., 2012) underlines the importance of standardized acoustic monitoring throughout Europe. The EGIM deployment at EMSO-Azores has been a very good test case with respect to interoperability and data accessibility, where data could be readily processed for instance for noise monitoring purposes. Redeployment of EGIM at the Azores will allow to build-up a long-term time series, recorded and processed using identical procedures, providing an excellent Marine Strategy Framework Directive data set for following the evolution of underwater noise levels in the coming years and for monitoring cetacean presence in general.
Complementing the Long-Term Central-Eastern Atlantic ESTOC Time Series With Deep-Ocean Observation
ESTOC site is an open-ocean reference for the long term observation of the Central-Eastern Atlantic. It is located within the weak southward return flows on the Eastern side of the North Atlantic subtropical gyre, well outside of the highly variable eastern boundary with its strong coastal upwelling regime (although interaction with this regime exists). The site is sufficiently deep to encompass the Eastern subtropical North Atlantic’s major water masses including the North Atlantic Deep Water (except the Antarctic Bottom Water current). ESTOC is windward of the Canary Islands and avoids wake effects of both the major currents and winds (Canary Current and Northeast Trade Winds). It is far enough from coasts and islands to serve as reference for satellite images and altimetry.
The time series observations at ESTOC (Delory et al., 2021a,b, c, d, e) complement our understanding of the biogeochemistry of the Subtropical North Atlantic by providing seasonally resolved, multi-year data from the eastern boundary of the gyre. The objective of the EGIM deployment on ESTOC was to observe, for the first time after 20 years of operation, oceanic processes near the sea bottom, a measurement anticipated at the early stage of the FixO34 project.
The EGIM and the mooring line were deployed in free-fall, from RV Angeles Alvariño (Spanish Institute of Oceanography, IEO), 60 miles north of Gran Canarias. The mooring line is a 14 mm Dyneema® rope with a short 3 m chain at the bottom. The layout of the mooring line comprises from the bottom up: a mooring weight, two acoustic releasers used for recovery, the EGIM, configured in standalone mode 70 m above seafloor, and the flotation at the top of the line. In order to reduce velocity and mitigate the damage during descent due to drag on cables and connectors, a sea “para-anchor” (i.e., acting as a parachute) was attached to the floatation at the top of the mooring. According to the EGIM CTD (Conductivity Temperature and Depth sensor) records, the module took about an hour to reach the bottom, with an estimated average descent time of 1 to 1.5 m/s and the actual deployment depth recorded was 3,580 m (pressure sensor data).
Water samples and CTD casts were collected at two points at nearby locations at 3,620 m depth, for salinity (CTD and Autosal), temperature (CTD) and dissolved oxygen (Winkler). It appears that the data recorded for temperature, salinity and oxygen is relevant with the sampling of the near bottom water performed at deployment time (Figure 10).
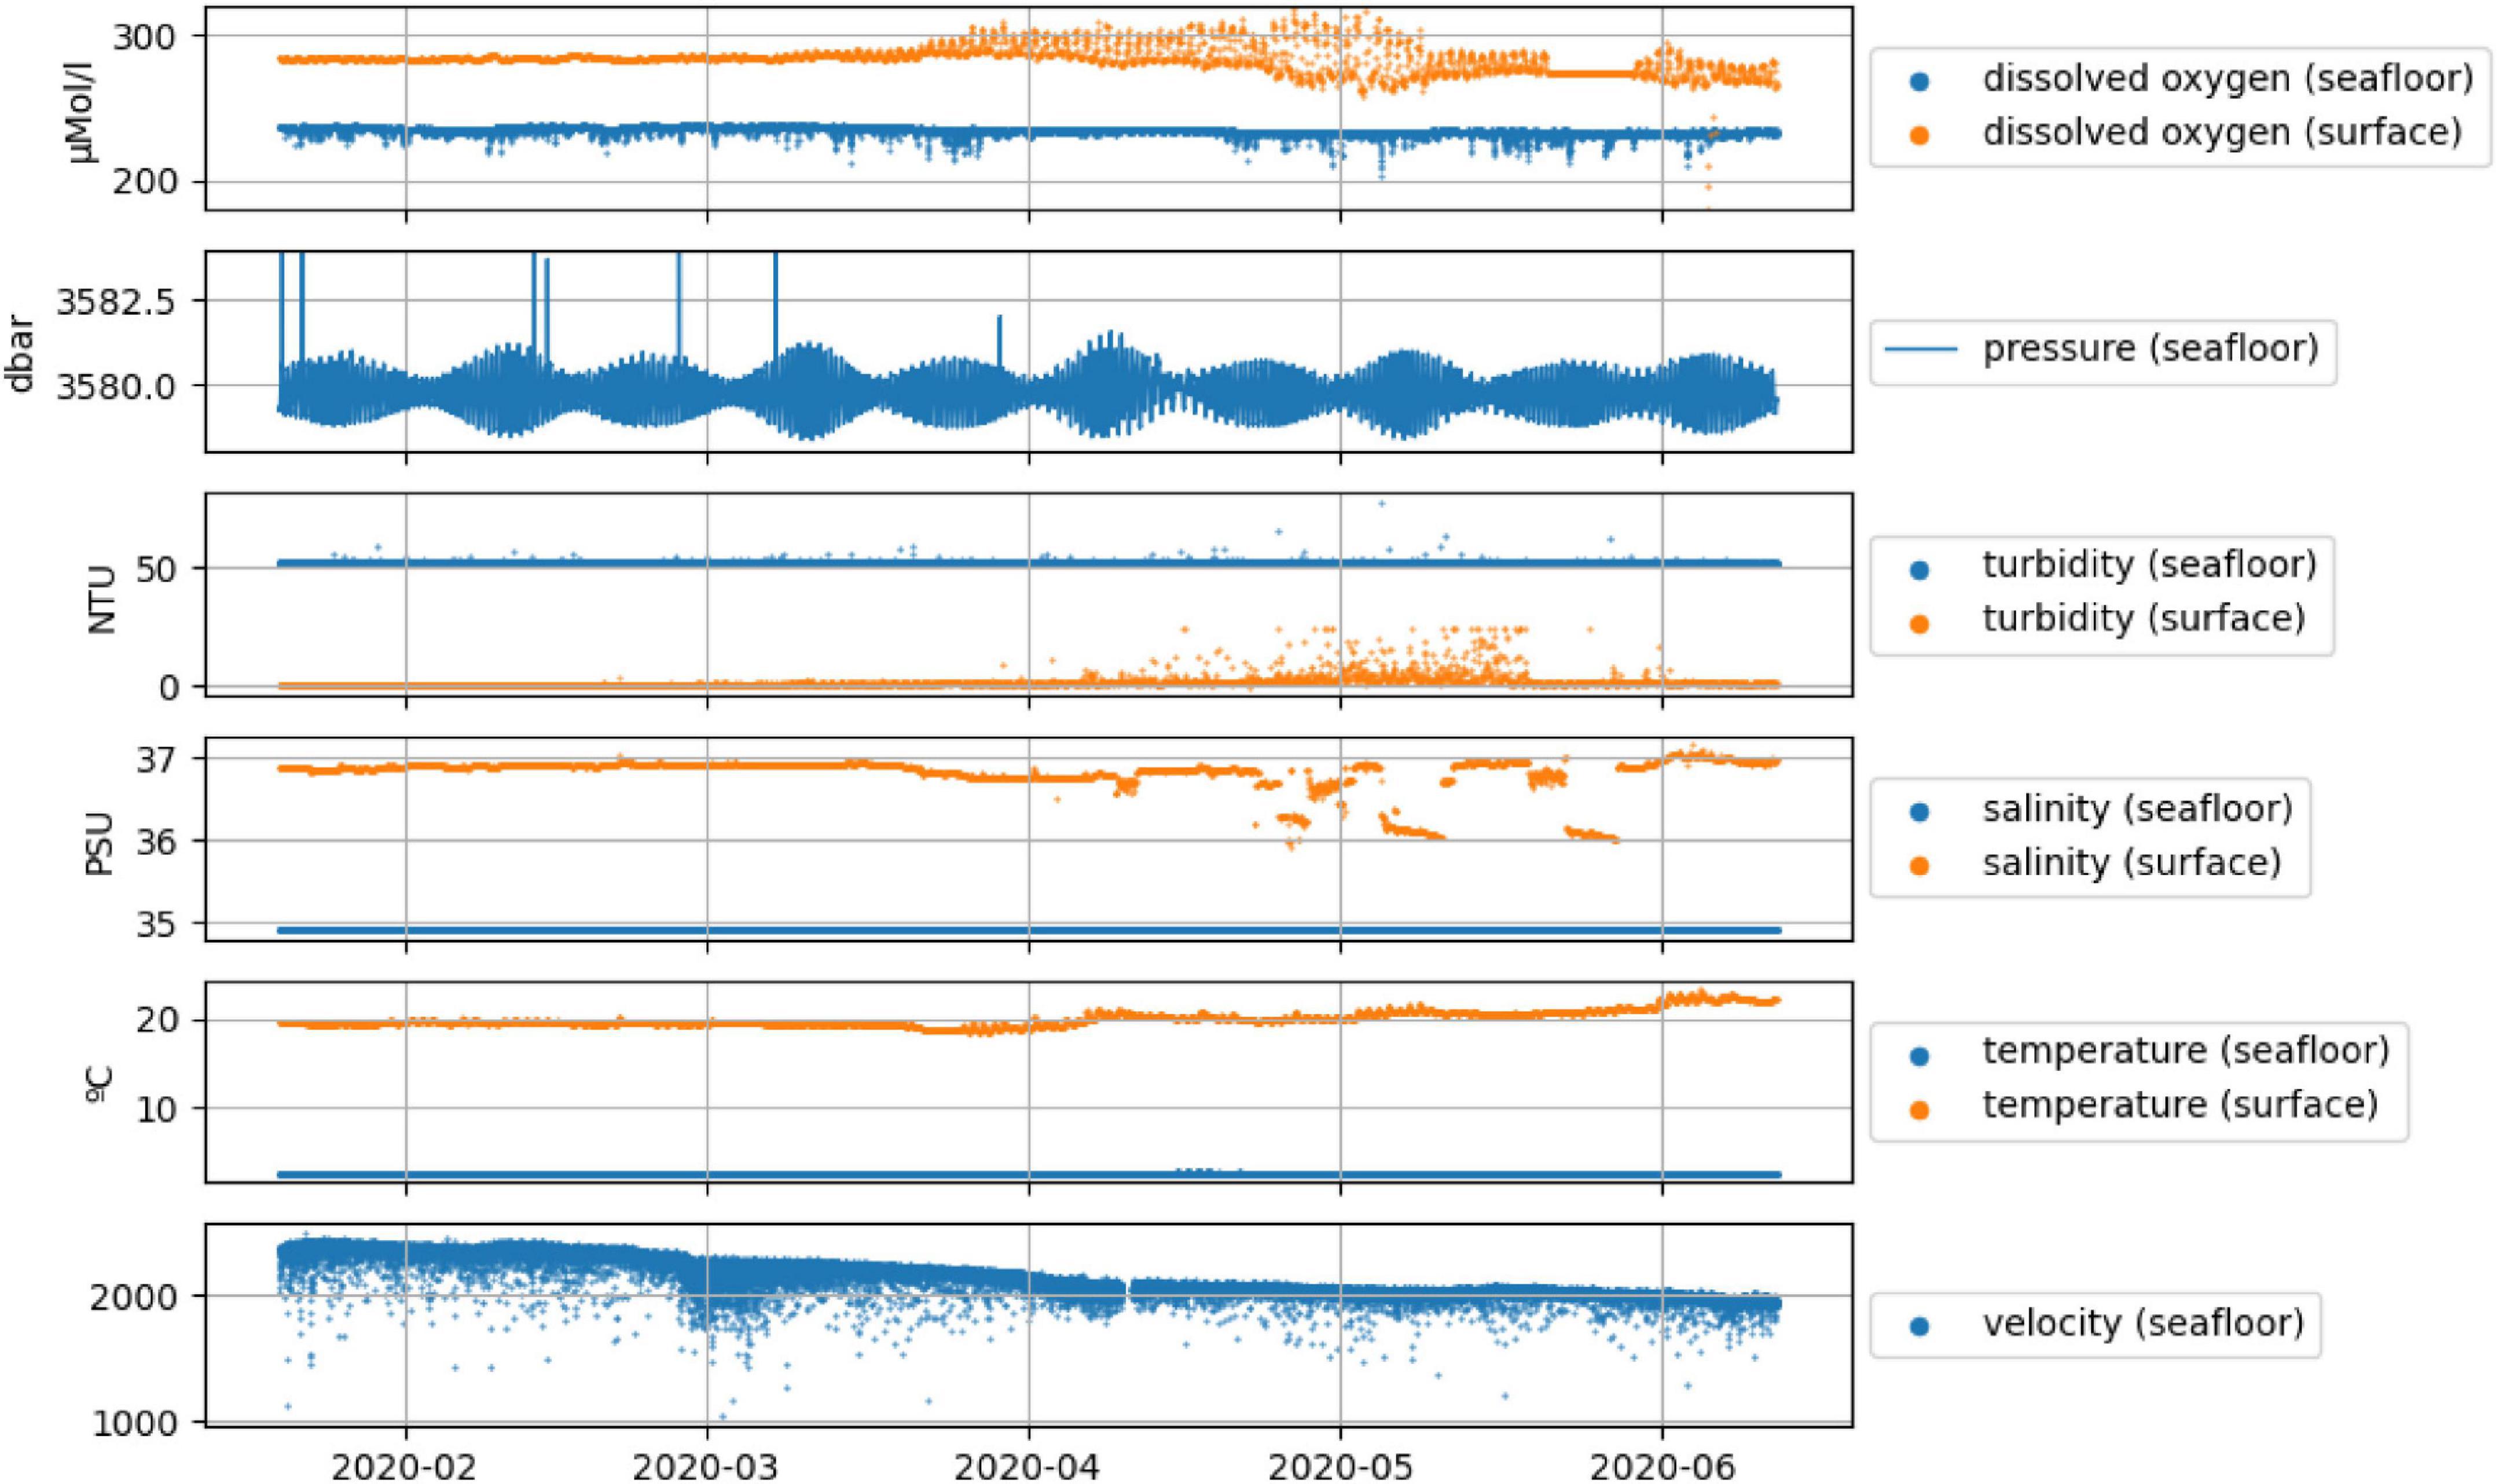
Figure 10. EGIM (blue) and surface buoy (orange) observations of dissolved oxygen, pressure, turbidity, salinity and temperature at ESTOC, in 3,600 m depth. Pressure and current velocity are not measured at the surface.
The data series was not complete. The acquisition or the data recording stopped for about a month and resumed with nominal function. The hydrophone recorded for the first 11 h with good quality signals, then halted, most probably due to a human mistake on the time configuration. A complete expertise is underway but this deployment managed by a new team pointed out a necessary refinement of the human-machine Interface which has since been enriched with additional range controls.
It also confirmed the potential of measuring the time series of Essential Ocean Variables along the water column not only in the upper segment but also near the seafloor. Following the visions of FixO34 project, collecting such series is expected to be a common practice at several EMSO sites (EMSO-Ligure-Dyfamed, NorEMSO-Mohn, EMSO-Azores, EMSO-Hellenic Arc).
EGIM Deployments Outcomes
Lessons were learnt during the 19 month period when the EGIM was operated by 4 different teams at OBSEA, EMSO-Azores, Catania and ESTOC in real operational situations. These led to software updates and hardware improvements. The deployments demonstrated the capability of the equipment in different configurations and site-specific conditions including data collection in shallow water, deep water, in the water column and near the seabed. Different modes of deployment and maintenance including diver operation, ROV attendance and deployment as a free-fall lander demonstrated the versatility of the system. The case studies illustrated the benefits of the EGIM to enrich the analyses and expand the observation coverage of an observatory to other areas of the core EMSO Science Services under the themes of Geo-hazards, Climate Change and Marine Ecosystems. The addition of the EGIM to EMSO observatories also enabled greater integration of different data sets for the production of data products which are relevant to environmental monitoring such as Marine Strategy Framework Directive indicators.
Conclusion: The EGIM, a Crucial Step Toward Standardization and Interoperability for Ocean Monitoring
Through the development of the EGIM, a deployment ready, upgradeable instrumentation that complies with EMSO best practices and recommendations, is available to EMSO Regional Facilities and to the wider marine science community (research and industry).
The EGIM will increase the service-provision capacity of the Regional Facilities and serve the EMSO ERIC aim of efficient collaborations at both EU and international level with related networks, Research Infrastructures, industry and other stakeholders. Issues such as networking, promotion of integrated scientific concepts, technical interoperability, common best practices and aligned services with other marine communities, are very high in the EMSO agenda. The EGIM is a direct contribution toward this endeavor, giving EMSO the leading role and the responsibility for the next steps in this direction.
The EGIM results demonstrate its value, particularly in standardization and interoperability in ocean observing. This is recognized by JERICO20, the network of European Coastal Observatories which will develop a version of the EGIM specific to the coastal zone. It will be designed, built and tested hosting a core set of sensors, compatible with open standards for sensor and data interoperability, ensuring interoperability with EMSO standards but optimized to shallower water depths (e.g., depth appropriate pressure housings and greater focus on bio-fouling).
The EGIM is also acknowledged by ONC-Ocean Networks Canada (Heesemann et al., 2014). Ocean Networks Canada is indeed planning to use the EGIM in both the Canadian Arctic (Cambridge Bay) and Antarctica. This will include the deployment in standalone, in cabled mode and the test of the data stream transfer to Ocean Networks Canada Data Management System. This will meet the scientific aim to provide data to better understand and protect fragile Arctic marine ecosystems. The deployment, initially scheduled for the end 2019 was delayed and now strongly depends on the evolution of the COVID-19 pandemic.
The EGIM concept offers solutions for challenges faced by maritime industry operators. Marine renewable energy test site operators are interested in the concept of the EGIM as it would allow test sites from across Europe and globally to compare a standard set of core parameters via the same data sampling frequency, with the same sensors. Offshore industries require increased efficiency in environmental monitoring and impact assessment. For example, long-term monitoring of decommissioned oil and gas fields could be supported by in situ autonomous monitoring with a system like the EGIM providing a substantial improvement in the temporal resolution of environmental monitoring while potentially providing cost savings and reduced carbon emissions through reduced ship time (Jones et al., 2019). In ports and harbors the coastal version of the EGIM could provide data which would be useful for navigation and could enable operators to monitor port activities such as dredging and other engineering works.
There are a number of intermediary and consultancy companies involved in environmental monitoring which could avail of the capabilities of the EGIM. These companies could potentially use data gathered by the EGIM as an input to the creation or enhancement of value-added information products in the support of specific end users. These companies are generally involved in marine environmental monitoring and meteocean forecasting.
The EGIM is also a move forward to preparedness (a concept used in health pandemics and environment catastrophe fields), essential to cope with some of the targeted scope fields of the subsea observatories such as tsunami, volcanoes or underwater megathrust seismic events and large pollution events. The national and international operation management in response to a natural disaster calls for scientific expertise and the research data sets from adequate sensors (several of them already available on the EGIM) under short notice. For example, the tsunami in Indonesia in 2004 led to scientific studies with immediate answers if based on satellite data, but not so fast if based on underwater measurements (Tilmann et al., 2010). This event constituted one driver for EMSO and for similar projects in Japan (Matsumoto et al., 2017; Mochizuki et al., 2018), Canada and United States (Wilcock et al., 2018) to pave the way for better preparedness including sharing know-how, and proposing EGIM technologies ready for deployment to measure in any ocean environment. An interesting application of the deployment of an EGIM in this context occurred in September 2021 with the eruption of the Cumbre Vieja volcano off the coast of La Palma, Canary Islands, in the contact zone of recent lava flows with the Atlantic Ocean, and a second deployment could follow to observe the underwater volcanic eruption which began in May 2018 about 50 km East of Mayotte (Lemoine et al., 2020).
A second long and deep-sea deployment started on Azores in May 2021 and others are on the way. On Western Ionian Sea, the equipment is ready, awaiting a ship of opportunity and ESTOC (Canary Archipelago) confirmed the intention to redeploy the system.
Following the European Commission requirement, the EGIM intellectual property is governed through a Joint Ownership Management Agreement signed among the EMSODEV project partners21. IFREMER, as lead party of this agreement, was granted authorization to assist the first replications of the EGIMs post-EMSODEV project. In the near future, EMSO will manage procurement and replication.
The EMSO ERIC structure of Service Groups (Science, Data, Engineering and Logistics, Communications and Industry and Innovation) will support the EGIM in terms of updates, evolutions and supervision of user’s contribution. This includes maintenance of the availability of the components, tracking instrument upgrades with a view to keep the system up to date with international standards. This also includes increasing deep ocean and biological data collection to enhance ocean observation (Levin et al., 2019): the coming developments for the EGIM scientific parameters include addition of biogeochemistry parameters (e.g., chlorophyll fluorescence/chlorophyll-A, pH, partial CO2 pressure, partial CH4 pressure and marine imaging systems).
These various perspectives underline that the EGIM can be considered as a milestone to meet the ocean monitoring need for standardization and interoperability and EMSO ERIC has endorsed the responsibility to go forward.
Data Availability Statement
The datasets presented in this study can be found in online repositories. The names of the repository/repositories and accession number(s) can be found below: Data from the EGIM, EMSO-Canarias (ESTOC), 2020. SEANOE. https://doi.org/10.17882/83639, https://doi.org/10.17882/83643, https://doi.org/10.17882/83646, https://doi.org/10.17882/83642, and https://doi.org/10.17882/83645. Data from the EGIM, EMSO-Azores observatory, 2017-2018. SEANOE. https://doi.org/10.17882/56665, https://doi.org/10.17882/56528, https://doi.org/10.17882/56501, https://doi.org/10.17882/56525, https://doi.org/10.17882/56626, https://doi.org/10.17882/57005, https://doi.org/10.17882/69867, and https://doi.org/10.17882/69976. Annotated images capturing fish abundances during the first deployment of the EMSO Generic Instrument Module (EGIM) at the OBSEA cabled observatory from December 2016 to April 2017. PANGAEA, https://doi.org/10.1594/PANGAEA.936693. Data collected during the first deployment of the EMSO Generic Instrument Module (EGIM) at the OBSEA cabled observatory from December, 2016 to April, 2017. PANGAEA, https://doi.org/10.1594/PANGAEA.883072.
Author Contributions
NL, HR, AG, EM, and JR started the project and established the frame. The group extended to JA, MC, ED, DE, RH, MM, GP, KR, J-FR, MS, JD, and PF reached an advanced version developing the context, the technological and IT aspects, the science use cases and the perspectives. EM took care of the charts. MA, JB, AC, MF, OG, SH, J-RL, JL, PP, JP, XR, DT, GM, BM, RS, and HW contributed to the work presented in the manuscript. All authors revised and enriched the manuscript, read and approved the submitted version.
Funding
This work was funded by the project EMSODEV (Grant agreement No 676555) supported by DG Research and Innovation of the European Commission under the Research Infrastructures Programme of the H2020. EMSO-link EC project (Grant agreement No 731036) provided additional funding. Other projects which supported the work include Plan Estatal de Investigación Científica y Técnica y de Innovación 2017–2020, project BITER-LANDER PID2020-114732RB-C32, iFADO (Innovation in the Framework of the Atlantic Deep Ocean, 2017–2021) EAPA_165/2016. The Spanish Government contributed through the “Severo Ochoa Centre Excellence” accreditation to ICM-CSIC (CEX2019-000928-S) and the Research Unit Tecnoterra (ICM-CSIC/UPC). UK colleagues were supported by Climate Linked Atlantic Sector Science (CLASS) project supported by NERC National Capability funding (NE/R015953/1).
Conflict of Interest
The authors declare that the research was conducted in the absence of any commercial or financial relationships that could be construed as a potential conflict of interest.
The handling Editor declared a shared affiliation with several of the authors JA, OG, JP, and JD. There is no other collaboration.
Publisher’s Note
All claims expressed in this article are solely those of the authors and do not necessarily represent those of their affiliated organizations, or those of the publisher, the editors and the reviewers. Any product that may be evaluated in this article, or claim that may be made by its manufacturer, is not guaranteed or endorsed by the publisher.
Acknowledgments
We would like to thank the crews, the technical and scientific support teams for their assistance and support during the deployment and recovery of the EGIM at the sites. We are grateful to the captain of the R/VPourquoi pas? as well as the pilots of the ROV Victor6000 for the MoMARSAT cruises on Azores. We are thankful to the PLOCAN Technical Support Group (GAT) team members for the ROV inspection, to the PLOCAN1 boat captain for his support in test-site operations and to the Spanish Institute of Oceanography (IEO) for the support at ESTOC site. This work used the EGI infrastructure with the dedicated support of INFNCATANIA-STACK. UPC-CSIC wants to acknowledge the support from Plan Estatal de Investigación Científica y Técnica y de Innovación 2017–2020, project BITER-LANDER PID2020-114732RB-C32.
Footnotes
- ^ https://ec.europa.eu/info/research-and-innovation/research-area/oceans-and-seas/eu-marine-strategy-framework-directive_en
- ^ https://www.ospar.org/
- ^ www.goosocean.org
- ^ https://en.wikipedia.org/wiki/European_Multidisciplinary_Seafloor_and_water_column_Observatory
- ^ http://emso.eu/observatories/#overview
- ^ www.emsodev.eu
- ^ https://en.wikipedia.org/wiki/Hotspot_Ecosystem_Research_and_Man%27s_Impact_On_European_Seas
- ^ https://gcos.wmo.int
- ^ https://it.wikipedia.org/wiki/Technology_Readiness_Level
- ^ https://github.com/52North/SOS
- ^ https://github.com/52North/helgoland
- ^ https://www.zabbix.com/
- ^ https://www.seanoe.org/
- ^ https://www.pangaea.de/
- ^ https://dataportals.pangaea.de/emso/
- ^ www.obsea.es
- ^ www.fishbase.org
- ^ https://vents-data.interridge.org/ventfield/lucky-strike
- ^ http://lido.listentothedeep.com/
- ^ https://www.jerico-ri.eu/
- ^ Requirements are available at: https://intellectual-property-helpdesk.ec.europa.eu/regional-helpdesks/european-ip-helpdesk_en
References
Aguzzi, J., Iveša, N., Gelli, M., Costa, C., Gavrilovic, A., Cukrov, N., et al. (2020a). Ecological video monitoring of marine protected areas by underwater cabled surveillance cameras. Mar. Policy 119:104052. doi: 10.1016/j.marpol.2020.104052
Aguzzi, J., López-Romero, D., Marini, S., Costa, C., Berry, A., Chumbinho, R., et al. (2020b). Multiparametric monitoring of fish activity rhythms in an Atlantic coastal cabled observatory. J. Mar. Systems 212:103424. doi: 10.1016/j.jmarsys.2020.103424
Aguzzi, J., Sbragaglia, V., Santamaría, G., del Río, J., Sardà, F., Nogueras, M., et al. (2013). Daily activity rhythms in temperate coastal fishes: insights from cabled observatory video monitoring. Mar. Ecol. Prog. Series 486, 223–236. doi: 10.3354/meps10399
André, M., van der Schaar, M., Zaugg, S., Houégnigan, L., Sánchez, A. M., and Castell, J. V. (2011). Listening to the deep: live monitoring of ocean noise and cetacean acoustic signals. Mar. Pollut. Bull. 63, 18–26. doi: 10.1016/j.marpolbul.2011.04.038
Baptista, A., Howe, B., Freire, J., Maier, D., and Silva, C. T. (2008). Scientific exploration in the era of ocean observatories. Comp. Sci. Eng. 10, 53–58. doi: 10.1109/MCSE.2008.83
Barreyre, T., Escartín, J., Sohn, R. A., Cannat, M., Ballu, V., and Crawford, W. C. (2014). Temporal variability and tidal modulation of hydrothermal exit-fluid temperatures at the Lucky Strike deep-sea vent field, Mid-Atlantic Ridge. J. Geophys. Res.: Solid Earth 119, 2543–2566. doi: 10.1002/2013JB010478
Barreyre, T., Fer, I., and Ferré, B. (2020). “The Norwegian node for the European Multidisciplinary Seafloor and water column observatory,” in Proceedings of the EGU General Assembly 2020, (Munich).
Bean, T. P., Greenwood, N., Beckett, R., Biermann, L., Bignell, J. P., Brant, J. L., et al. (2017). A review of the tools used for marine monitoring in the UK: combining historic and contemporary methods with modeling and socioeconomics to fulfill legislative needs and scientific ambitions. Front. Mar. Sci. 4:263. doi: 10.3389/fmars.2017.00263
Best, M. M. R., Favali, P., Beranzoli, L., Blandin, J., Çağatay, N. M., Cannat, M., et al. (2016). The EMSO ERIC pan-european consortium: data benefits and lessons learned at the legal entity forms. Mar. Technol. Soc. J. 50, 8–15.
Best, M. M. R., Favali, P., Beranzoli, L., Cannat, M., Çağatay, N. M., Dañobeitia, J. J., et al. (2014). EMSO: a distributed infrastructure for addressing geo-hazards and global ocean change. Oceanography 27, 167–169. doi: 10.5670/oceanog.2014.52
Botts, M., and Robin, A. (2014). OGC§SensorML OGC 12-000. Rockville, MD: Open Geospatial Consortium.
Bröring, A., Echterhoff, J., Jirka, S., Simonis, I., Everding, T., Stasch, C., et al. (2011). New generation sensor web enablement. Sensors 11, 2652–2699. doi: 10.3390/s110302652
Bröring, A., Stasch, C., and Echterhoff, J. (2012). OGC Sensor Observation Service. Wayland, MA: Open Geospatial Consortium.
Cannat, M. (2018). MOMARSAT2018 cruise, RV L’Atalante. French Oceanographic Cruises doi: 10.17600/18000514
Cannat, M., Sarradin, P.-M., Blandin, J., Escartin, J., Colaco, A., Aron, M., et al. (2011). “MoMar-Demo at lucky strike. a near-real time multidisciplinary observatory of hydrothermal processes and ecosystems at the mid-atlantic ridge,” in Proceedings of the AGU Fall Meeting Abstracts, 2011, OS22A-05. (San Francisco, CA)
Cannat, M., Wheeler, B., Rouméjon, S., Sarradin, P.-M., and Legrand, J. (2018). Array of Ocean Bottom Tilt Current Meters: data from the EMSO-Azores Observatory, 2017-2018. St, Milford, CT: SEANOE. doi: 10.17882/57005
Cooper, M. J., Elderfield, H., and Schultz, A. (2000). Diffuse hydrothermal fluids from Lucky Strike hydrothermal vent field: evidence for a shallow conductively heated system. J. Geophys. Res. Solid Earth 105, 19369–19375. doi: 10.1029/2000JB900138
Coppola, L., Ntoumas, M., Bozzano, R., Bensi, M., Hartman, S. E., Charcos Llorens, M., et al. (2016). Handbook of Best Practices for Open Ocean Fixed Observatories. Brussels: European Commission
Cusi, S., Rodriguez, P., Pujol, N., Pairaud, I., Nogueras, M., Antonijuan, J., et al. (2017). “Evaluation of AUV-borne ADCP measurements in different navigation modes,” in Proceedings of the OCEANS 2017, (Aberdeen: IEEE) doi: 10.1109/OCEANSE.2017.8084688
Danovaro, R., Carugati, L., Berzano, M., Cahill, A. E., Carvalho, S., Chenuil, A., et al. (2016). Implementing and innovating marine monitoring approaches for assessing marine environmental status. Front. Mar. Sci. 3:213. doi: 10.3389/fmars.2016.00213
Dañobeitia, J. J., Pouliquen, S., Johannessen, T., Basset, A., Cannat, M., Pfeil, B. G., et al. (2020). Toward a comprehensive and integrated strategy of the European marine research infrastructures for ocean observations. Front. Mar. Sci. 7:180. doi: 10.3389/fmars.2020.00180
del Rio, J., Francescangeli, M., Nogueras Cervera, M., Toma, D. M., Cadena Muñoz, J., Martinez Padro, E., et al. (2021). Annotated Images Capturing Fish Abundances During the First Deployment of the EMSO Generic Instrument Module (EGIM) at the OBSEA Cabled Observatory from December 2016 to April 2017. Los Angeles, CA: PANGAEA.
del Rio, J., Nogueras, M., Toma, D. M., Martinez, E., Artero-Delgado, C., Bghiel, I., et al. (2020). Obsea: a decadal balance for a cabled observatory deployment. IEEE Access 8, 33163–33177. doi: 10.1109/ACCESS.2020.2973771
del Rio, J., Toma, D. M., Martinez, E., O’Reilly, T. C., Delory, E., Pearlman, J. S., et al. (2018). A sensor web architecture for integrating smart oceanographic sensors into the semantic sensor web. IEEE J. Oceanic Eng. 43, 830–842. doi: 10.1109/JOE.2017.2768178
Delory, E., Santana, R., Moran, R., Remirez, X., Marrero, R., Cianca, A., et al. (2021a). Dissolved Oxygen and Temperature on Water Column, Data from the EGIM, EMSO-Canarias (ESTOC), 2020. St, Milford, CT: SEANOE, doi: 10.17882/83639
Delory, E., Santana, R., Moran, R., Remirez, X., Marrero, R., Cianca, A., et al. (2021b). Currents on Water Column, data from the EGIM, EMSO-Canarias (ESTOC), 2020. St, Milford, CT: SEANOE, doi: 10.17882/83643
Delory, E., Santana, R., Moran, R., Remirez, X., Marrero, R., Cianca, A., et al. (2021c). Conductivity, Temperature and Pressure data on Water Column, data from the EGIM, EMSO-Canarias (ESTOC), 2020. St, Milford, CT: SEANOE, doi: 10.17882/83646
Delory, E., Santana, R., Moran, R., Remirez, X., Marrero, R., Cianca, A., et al. (2021d). High-precision Pressure and Temperature on Water Column, data from the EGIM, EMSO-Canarias (ESTOC), 2020. St, Milford, CT: SEANOE.
Delory, E., Santana, R., Moran, R., Remirez, X., Marrero, R., Cianca, A., et al. (2021e). Turbidity and Chlorophyll on Water Column, data from the EGIM, EMSO-Canarias (ESTOC), 2020. St, Milford, CT: SEANOE.
Favali, P., Beranzoli, L., and De Santis, A. (Eds.) (2015). Seafloor Observatories: A New Vision of the Earth from the Abyss, Springer-Praxis Books in Geophysical Sciences. New York, NY: Springer-Verlag Berlin Heidelberg, 676. doi: 10.1007/978-3-642-11374-1
Favali, P., Person, R., Barnes, C. R., Kaneda, Y., Delaney, J. R., and Hsu, S.-K. (2010). “Seafloor observatory science,” in Proceedings of the OceanObs’09: Sustained Ocean, eds J. Hall, D. E. Harrison, and D. Stammer (Venice: Observations and Information for Society).
Gaughan, P., Berry, A., and Malley, C. O. (2019). “The dual roles of smartbay, a multi-disciplinary subsea observatory delivering sustainable long term coastal marine observations and marine technology development,” in proceedings of the OCEANS 2019. (Marseille). doi: 10.1109/OCEANSE.2019.8867042
Girard, F., Sarrazin, J., Arnaubec, A., Cannat, M., Sarradin, P.-M., Wheeler, B., et al. (2020). Currents and topography drive assemblage distribution on an active hydrothermal edifice. Prog. Oceanography 187:102397. doi: 10.1016/j.pocean.2020.102397
Glover, A. G., Gooday, A. J., Bailey, D. M., Billett, D. S. M., Chevaldonné, P., Colaço, A., et al. (2010). Temporal change in deep-sea benthic ecosystems. Adv. Mar. Biol. 58, 1–95. doi: 10.1016/B978-0-12-381015-1.00001-0
Hartman, S. E., Bett, B. J., Durden, J. M., Henson, S. A., Iversen, M., Jeffreys, R. M., et al. (2021). Enduring science: three decades of observing the Northeast Atlantic from the Porcupine Abyssal Plain Sustained Observatory (PAP-SO). Prog. Oceanography 191:102508.
Heesemann, M., Insua, T., Scherwath, M., Juniper, K., and Moran, K. (2014). Ocean networks Canada: from geo-hazards research laboratories to smart ocean systems. Oceanography 27, 151–153. doi: 10.5670/oceanog.2014.50
Henson, S. A., Beaulieu, C., and Lampitt, R. S. (2016). Observing climate change trends in ocean biogeochemistry: when and where. Global Change Biol. 22, 1561–1571. doi: 10.1111/gcb.13152
Jones, D. O. B., Gates, A. R., Huvenne, V. A. I., Phillips, A. B., and Bett, B. J. (2019). Autonomous marine environmental monitoring: application in decommissioned oil fields. Sci. Total Environ. 668, 835–853. doi: 10.1016/j.scitotenv.2019.02.310
Klingelhoefer, F., Barbot, S., Lanteri, N., and Geli, L. (2017). Video, data from EMSO-Molène Observatory, 2016-05-02 to 2016-05-25. St, Milford, CT: SEANOE.
Laes, A., Sarradin, P.-M., and Cannat, M. (2019). CHEMINI Total Dissolved Iron Concentrations from the EMSO-Azores Observatory, 2017-2018. St, Milford, CT: SEANOE.
Lefevre, D., Zakardkjian, B., and Embarcio, D. (2019). Unique observatories for sea science and particle astrophysics: the EMSO-Antares and EMSO-Western Ionian nodes in the Mediterranean Sea. EPJ Web Conferences 207:09004. doi: 10.1051/epjconf/201920709004
Legrand, J., Gautier, L., Moreau, B., Blandin, J., Coail, J. Y., Le Vourc’h, D., et al. (2019). “COSTOF2, a smart solution for multisensor marine observations,” in Proceedings of the OCEANS 2019 (Marseille).
Lemoine, A., Briole, P., Bertil, D., Roullé, A., Foumelis, M., Thinon, I., et al. (2020). The 2018–2019 seismo-volcanic crisis east of Mayotte, Comoros islands: seismicity and ground deformation markers of an exceptional submarine eruption. Geophys. J. Int. 223, 22–44. doi: 10.1093/gji/ggaa273
Levin, L. A., Bett, B. J., Gates, A. R., Heimbach, P., Howe, B. M., Janssen, F., et al. (2019). Global observing needs in the deep ocean. Front. Mar. Sci. 6:241. doi: 10.3389/fmars.2019.00241
Lo Bue, N., Best, M. M. R., Embriaco, D., Abeysirigunawardena, D., Beranzoli, L., Dewey, R. K., et al. (2021). The importance of marine research infrastructures in capturing processes and impacts of extreme events. Front. Mar. Sci. 8:626668. doi: 10.3389/fmars.2021.626668
Lykousis, V., Nittis, K., Ballas, D., Perivoliotis, L., Kassis, D., Pagonis, P., et al. (2015). “The hellenic deep sea observatory: science objectives and implementation,” in Seafloor Observatories: A New Vision of the Earth from the Abyss, eds P. Favali, L. Beranzoli, and A. De Santis (Berlin: Springer International Publishing).
Martinez, E., Garcia-Benadi, A., Toma, D. M., Delory, E., Gomariz, S., and del Rio, J. (2021). Metadata-driven universal real-time ocean sound measurement architecture. IEEE Access 9, 28282–28301. doi: 10.1109/access.2021.3058744
Martínez, E., Toma, D. M., Jirka, S., and del Río, J. (2017). Middleware for plug and play integration of heterogeneous sensor resources into the sensor web. Sensors 17:2923. doi: 10.3390/s17122923
Matsumoto, H., Nosov, M. A., Kolesov, S. V., and Kaneda, Y. (2017). Analysis of pressure and acceleration signals from the 2011 Tohoku Earthquake observed by the DONET seafloor network. J. Disaster Res. 12, 163–175. doi: 10.20965/jdr.2017.p0163
Miloslavich, P., Bax, N. J., Simmons, S. E., Klein, E., Appeltans, W., Aburto-Oropeza, O., et al. (2018). Essential ocean variables for global sustained observations of biodiversity and ecosystem changes. Global Change Biol. 24, 2416–2433. doi: 10.1111/gcb.14108
Mochizuki, M., Uehira, K., Kanazawa, T., Kunugi, T., Shiomi, K., Aoi, S., et al. (2018). “S-Net project: performance of a large-scale seafloor observation network for preventing and reducing seismic and tsunami disasters,” in Proceedings of the 2018 OCEANS - MTS/IEEE Kobe Techno-Oceans (OTO), (Piscataway, NJ: IEEE).
Monna, M., Falcone, G., Beranzoli, L., Chierici, F., Cianchini, G., De Caro, M., et al. (2014). Underwater geophysical monitoring for European Multidisciplinary Seafloor and water-column observatories. J. Mar. Systems 130, 12–30. doi: 10.1016/j.jmarsys.2013.09.010
NF X10-812 (2013). Marine Environment - Oceanographic Instrumentation - Guide for Environmental Tests. Paris: Association Française de Normalisation (AFNOR).
Ondréas, H., Cannat, M., Fouquet, Y., Normand, A., Sarradin, P.-M., and Sarrazin, J. (2009). Recent volcanic events and the distribution of hydrothermal venting at the Lucky Strike hydrothermal field, Mid-Atlantic ridge. Geochem. Geophys. Geosystems 10:Q02006. doi: 10.1029/2008GC002171
Pearlman, J., Bushnell, M., Coppola, L., Karstensen, J., Buttigieg, P. L., Pearlman, F., et al. (2019). Evolving and sustaining ocean best practices and standards for the next decade. Front. Mar. Sci. 6:277. doi: 10.3389/fmars.2019.00277
Person, R., Favali, P., Ruhl, H. A., Beranzoli, L., Rolin, J.-F., Waldmann, C., et al. (2015). “From ESONET multidisciplinary scientific community to EMSO novel European research infrastructure for ocean observation,” in Seafloor Observatories: A New Vision of the Earth from the Abyss, Springer-Praxis books in Geophysical Sciences, eds P. Favali, L. Beranzoli, and A. De Santis (Berlin: Springer), 531–563. doi: 10.1007/978-3-642-11374-1_20
Ruhl, H. A., André, M., Beranzoli, L., Çağatay, M. N., Colaço, A., Cannat, M., et al. (2011). Societal need for improved understanding of climate change, anthropogenic impacts, and geo-hazard warning drive development of ocean observatories in European Seas. Prog. Oceanography 91, 1–33. doi: 10.1016/j.pocean.2011.05.001
Santana-Casiano, J. M., González-Dávila, M., Rueda, M.-J., Llinás, O., and González-Dávila, E.-F. (2007). The interannual variability of oceanic CO 2 parameters in the northeast Atlantic subtropical gyre at the ESTOC site. Global Biogeochem. Cycles 21:1015. doi: 10.1029/2006GB002788
Sarradin, P.-M., and Cannat, M. (2017). MOMARSAT2017 cruise, RV Pourquoi pas? French Oceanographic Cruises doi: 10.17600/17000500
Sarradin, P.-M., Legrand, J., and Cannat, M. (2019). Turbidity (NTU) data from the EMSO-Azores Observatory, 2017-2018. St, Milford, CT: SEANOE.
Sarradin, P.-M., Legrand, J., Moreau, B., Lanteri, N., and Cannat, M. (2018a). Currents on Water Column, data from the EGIM, EMSO-Azores Observatory, 2017-2018. St, Milford, CT: SEANOE.
Sarradin, P.-M., Legrand, J., Moreau, B., Lanteri, N., and Cannat, M. (2018b). Conductivity, Temperature and Pressure, data from the EGIM Deployed on EMSO-Azores Observatory, 2017-2018. St, Milford, CT: SEANOE.
Sarradin, P.-M., Legrand, J., Moreau, B., Lanteri, N., and Cannat, M. (2018c). Temperature and Dissolved Oxygen Concentrations, data from the EGIM, EMSO-Azores Observatory, 2017-2018. St, Milford, CT: SEANOE.
Sarradin, P.-M., Legrand, J., Moreau, B., Lanteri, N., and Cannat, M. (2018d). Turbidity and Chlorophyll, data from the EGIM Deployed on EMSO-Azores Observatory, 2017-2018. St, Milford, CT: SEANOE.
Sarradin, P.-M., Legrand, J., Moreau, B., Lanteri, N., and Cannat, M. (2018e). Acoustic Signal, data from the EGIM, EMSO-Azores Observatory, 2017-2018. St, Milford, CT: SEANOE.
Scheirer, D. S., Shank, T. M., and Fornari, D. J. (2006). Temperature variations at diffuse and focused flow hydrothermal vent sites along the northern East Pacific Rise. Geochem. Geophys. Geosystems 7:Q03002. doi: 10.1029/2005GC001094
Schultz, A., and Elderfield, H. (1997). Controls on the physics and chemistry of seafloor hydrothermal circulation. Philos. Trans. R. Soc. London. Series A: Mathematical Phys. Eng. Sci. 355, 387–425. doi: 10.1098/rsta.1997.0014
Silva, M. A., Prieto, R., Magalhães, S., Cabecinhas, R., Cruz, A., Gonçalves, J. M., et al. (2003). Occurrence and distribution of cetaceans in the waters around the Azores (Portugal), Summer and Autumn 1999-2000. Aquatic Mammals 29, 77–83. doi: 10.1578/016754203101024095
The European Parliament and the Council of the European Union (2008). Marine strategy framework directive. Official J. Eur. Union 164, 19–40.
Tilmann, F. J., Craig, T. J., Grevemeyer, I., Suwargadi, B., Kopp, H., and Flueh, E. (2010). The updip seismic/aseismic transition of the Sumatra megathrust illuminated by aftershocks of the 2004 Aceh-Andaman and 2005 Nias events. Geophys. J. Int. 181, 1261–1274. doi: 10.1111/j.1365-246X.2010.04597.x
Tivey, M. K., Bradley, A. M., Joyce, T. M., and Kadko, D. (2002). Insights into tide-related variability at seafloor hydrothermal vents from time-series temperature measurements. Earth Plan. Sci. Lett. 202, 693–707. doi: 10.1016/S0012-821X(02)00801-4
Toma, D. M., Beranzoli, L., Dañobeitia, J. J., del Rio, J., Garcia, O., Jesus, S. M., et al. (2017). Data Collected During the First Deployment of the EMSO Generic Instrument Module (EGIM) at the OBSEA Cabled Observatory from December, 2016 to April, 2017. Los Angeles, CA: PANGAEA.
Van der Graaf, A. J., Ainslie, M. A., André, M., Brensing, K., Dalen, J., Dekeling, R. P. A., et al. (2012). European Marine Strategy Framework Directive Good Environmental Status (MSFD-GES): Report of the Technical Subgroup on Underwater Noise and other forms of Energy. Luxembourg: European Union
Visbeck, M. (2018). Ocean science research is key for a sustainable future. Nat. Commun. 9:690. doi: 10.1038/s41467-018-03158-3
Weller, R. A., Baker, D. J., Glackin, M. M., Roberts, S. J., Schmitt, R. W., Twigg, E. S., et al. (2019). The challenge of sustaining ocean observations. Front. Mar. Sci. 6:105. doi: 10.3389/fmars.2019.00105
Wilcock, W., Dziak, R., Tolstoy, M., Chadwick, W., Nooner, S., Bohnenstiel, D., et al. (2018). The recent volcanic history of axial seamount: geophysical insights into past eruption dynamics with an eye toward enhanced observations of future eruptions. Oceanography 31, 114–123. doi: 10.5670/oceanog.2018.117
Keywords: fixed-point observatories, multi-parametric monitoring, seafloor, water column, EMSO, EGIM, EOV
Citation: Lantéri N, Ruhl HA, Gates A, Martínez E, del Rio Fernandez J, Aguzzi J, Cannat M, Delory E, Embriaco D, Huber R, Matabos M, Petihakis G, Reilly K, Rolin J-F, van der Schaar M, André M, Blandin J, Cianca A, Francescangeli M, Garcia O, Hartman S, Lagadec J-R, Legrand J, Pagonis P, Piera J, Remirez X, Toma DM, Marinaro G, Moreau B, Santana R, Wright H, Dañobeitia JJ and Favali P (2022) The EMSO Generic Instrument Module (EGIM): Standardized and Interoperable Instrumentation for Ocean Observation. Front. Mar. Sci. 9:801033. doi: 10.3389/fmars.2022.801033
Received: 24 October 2021; Accepted: 02 February 2022;
Published: 18 March 2022.
Edited by:
Ananda Pascual, Mediterranean Institute for Advanced Studies, Spanish National Research Council (CSIC), SpainReviewed by:
Katrin Schroeder, Institute of Marine Science, National Research Council (CNR), ItalyFraser J. Davidson, Fisheries and Oceans Canada, Canada
Copyright © 2022 Lantéri, Ruhl, Gates, Martínez, del Rio Fernandez, Aguzzi, Cannat, Delory, Embriaco, Huber, Matabos, Petihakis, Reilly, Rolin, van der Schaar, André, Blandin, Cianca, Francescangeli, Garcia, Hartman, Lagadec, Legrand, Pagonis, Piera, Remirez, Toma, Marinaro, Moreau, Santana, Wright, Dañobeitia and Favali. This is an open-access article distributed under the terms of the Creative Commons Attribution License (CC BY). The use, distribution or reproduction in other forums is permitted, provided the original author(s) and the copyright owner(s) are credited and that the original publication in this journal is cited, in accordance with accepted academic practice. No use, distribution or reproduction is permitted which does not comply with these terms.
*Correspondence: Nadine Lantéri, nlanteri@ifremer.fr