Practical Application of a Bioenergetic Model to Inform Management of a Declining Fur Seal Population and Their Commercially Important Prey
 Elizabeth A. McHuron1*
  Katie Luxa2 Noel A. Pelland2
  Kirstin Holsman3 Rolf Ream2 Tonya Zeppelin2 Jeremy T. Sterling2
- 1Cooperative Institute for Climate, Ocean, and Ecosystem Studies, University of Washington, Seattle, WA, United States
- 2Marine Mammal Laboratory, Alaska Fisheries Science Center, National Marine Fisheries Service – NOAA, Seattle, WA, United States
- 3Alaska Fisheries Science Center, National Marine Fisheries Service – NOAA, Seattle, WA, United States
Food availability is a key concern for the conservation of marine top predators, particularly during a time when they face a rapidly changing environment and continued pressure from commercial fishing activities. Northern fur seals (Callorhinus ursinus) breeding on the Pribilof Islands in the eastern Bering Sea have experienced an unexplained population decline since the late-1990s. Dietary overlap with a large U.S. fishery for walleye pollock (Gadus chalcogrammus) in combination with changes in maternal foraging behavior and pup growth has led to the hypothesis that food limitation may be contributing to the population decline. We developed age- and sex-specific bioenergetic models to estimate fur seal energy intake from May–December in six target years, which were combined with diet data to quantify prey consumption. There was considerable sex- and age-specific variation in energy intake because of differences in body size, energetic costs, and behavior; net energy intake was lowest for juveniles (18.9 MJ sea-day–1, 1,409.4 MJ season–1) and highest for adult males (66.0 MJ sea-day–1, 7,651.7 MJ season–1). Population-level prey consumption ranged from 255,232 t (222,159 – 350,755 t, 95% CI) in 2006 to 500,039 t (453,720 – 555,205 t) in 1996, with pollock comprising between 41.4 and 76.5% of this biomass. Interannual variation in size-specific pollock consumption appeared largely driven by the availability of juvenile fish, with up to 81.6% of pollock biomass coming from mature pollock in years of poor age-1 recruitment. Relationships among metabolic rates, trip durations, pup growth rates, and energy intake of lactating females suggest the most feasible mechanism to increase pup growth rates is by increasing foraging efficiency through reductions in maternal foraging effort, which is unlikely to occur without increases in localized prey density. By quantifying year-specific fur seal consumption of pollock, our study provides a pathway to incorporate fur seals into multispecies pollock stock assessment models, which is critical for fur seal and fishery management given they were a significant source of mortality for both juvenile and mature pollock.
Introduction
Availability of food resources is a strong driver of population dynamics, and changes in the abundance, type, or distribution of resources can have wide-ranging impacts on wildlife populations (Sillett et al., 2000; Roth, 2002; Oro et al., 2004). These changes may occur through a variety of mechanisms, including natural or human-driven environmental variability (Ogutu and Owen-Smith, 2003; Trivelpiece et al., 2011), density-dependent processes (Elliott et al., 2009; Kuhn et al., 2014a), or as a result of human activities (Valeix et al., 2012). Identification of the specific ways that these mechanisms affect vital rates and population dynamics requires an understanding of energy requirements and prey consumption, which are also necessary for quantifying species- and community-level interactions. The development of bioenergetic models—data-driven estimates of individual- and population-level energy and prey requirements—is thus crucial for wildlife conservation, particularly as it relates to understanding the role of food availability in population declines and management of commercially important prey species. This is a pressing issue in marine environments, where food availability has been implicated as a contributing factor to current population declines of many seabirds and marine mammals (Becker and Beissinger, 2006; Ford et al., 2010; Grémillet et al., 2016), and fishing pressures may exacerbate the negative impacts of climate change on prey populations (Essington et al., 2015; Lindegren et al., 2018).
Northern fur seals (Callorhinus ursinus) are a sexually dimorphic marine mammal that inhabits pelagic habitats throughout the North Pacific. In the United States, the majority of fur seals are managed as part of the Eastern Pacific Stock, which includes seals that breed on Bogoslof Island and the Pribilof Islands (includes St. Paul and St. George Islands) in the Bering Sea. This stock was listed as “depleted” under the U.S. Marine Mammal Protection Act in 1988 because the population had declined to less than 50% of the population size during the late 1950s. A portion of this decline was attributed to a female harvest (York and Hartley, 1981), but this stock has experienced a continual and unexplained population decline since the late-1990s (Towell et al., 2006). This decline is mainly driven by St. Paul Island, the largest breeding rookery, where the population has declined at a rate of over 4% per year since 1998 (Muto et al., 2020). In contrast, the fur seal population at St. George Island has recently stabilized and the population at Bogoslof Island continues to experience healthy population growth since its colonization in the 1980s (Muto et al., 2020).
Food availability has long been hypothesized as a driving factor of fur seal population declines (Trites, 1992), although this hypothesis has yet to be adequately addressed for the current decline. While all age classes forage at some point while in the Bering Sea, lactating females are particularly susceptible to changes in local prey resources because they must balance energy gain at sea with the fasting ability of their pup during an energetically demanding time period. Pup growth rates at Bogoslof Island are almost double those at St. Paul Island (Banks et al., 2006), which has population implications given offspring mass at weaning is a strong determinate of survival probability in many mammalian species (Ronget et al., 2018). Increases in maternal trip duration adversely impact pup growth rates and survival for many otariid species (Costa et al., 1989; Lunn et al., 1993; Georges and Guinet, 2000), which is consistent with observations that maternal trip durations are considerably longer on the Pribilof Islands (5–9 days, Call et al., 2008; Kuhn et al., 2014b) compared with Bogoslof Island (1–3 days, Kuhn et al., 2014a). These long foraging trips and subsequent low pup growth rates suggest that female fur seals from the Pribilof Islands may be unable to find sufficient prey resources in close proximity to the rookery and must therefore travel further and spend more time at sea to find prey.
Northern fur seals consume a variety of prey but walleye pollock (Gadus chalcogrammus, hereafter referred to as pollock) has been a dominant fur seal prey species in the eastern Bering Sea for the last 100+ years (Lucas, 1899; Kajimura, 1984; Zeppelin and Ream, 2006). There is temporal and spatial variability in the dependence on pollock (Antonelis et al., 1997; Zeppelin and Ream, 2006), which is likely driven by variability in pollock abundance and differences in physical and environmental features among the foraging habitats surrounding each breeding site. Pollock is also the target species for the largest U.S. commercial fishery by volume, which has harvested an average of ∼1.2 million t annually in the eastern Bering Sea since 1977 (Ianelli et al., 2019). The fishery operates year-round, with the majority of fishing effort during the “B” Season (the season that overlaps with fur seal presence in the eastern Bering Sea) occurring in foraging areas used by fur seals from St. Paul Island (Haynie and Pfeiffer, 2013). In addition to fishery removals, pollock biomass is predicted to decline considerably in the next two decades as water temperatures increase and the size of the cold pool—a region of low bottom water temperatures resulting from ice formation on the Bering Sea shelf—decreases, which adversely affects recruitment through reductions in energy gain and increases in predation mortality (Mueter et al., 2011; Ianelli et al., 2016; Spencer et al., 2016).
The pollock fishery is one of the most prominent examples of long-term sustainability through an ecosystem approach to single-species fisheries management (Livingston et al., 2011; Dolan et al., 2016). In accordance with the Magnusson Stevens Act, the fishery is managed using acceptable biological catch from a single species assessment model and an annually invariant mortality parameter, as is commonplace for assessment models (Ianelli et al., 2019). Since 2016, harvest and biological reference points from a multispecies assessment (CEATTLE, Holsman et al., 2016; Ianelli et al., 2016) have been included as an appendix to the assessment to provide additional ecosystem context for setting the acceptable biological catch and to help account for annually varying predation mortality. The CEATTLE model includes the effects of climate and predation by three fish predators—pollock (adults are cannibalistic), arrowtooth flounder (Atheresthes stomais), and Pacific cod (Gadus macrocephalus)—on pollock population dynamics. This model does not explicitly account for mortality due to fur seals, and while it is well established that pollock is an important prey resource, there have been no efforts to estimate population-level consumption since the early 1990s (Perez and McAlister, 1993). Early studies hypothesized that the fishery might be beneficial to fur seals because removal of mature pollock would increase the availability of juvenile fish (Swartzman and Haar, 1980), evidenced from the combination of high pollock cannibalism (Gaichas et al., 2015; Livingston et al., 2017) and early fur seal diet data pointing toward the predominance of small pollock in diets (Swartzman and Haar, 1980; Sinclair et al., 1993). Recent diet studies indicate that fur seals consume both juvenile and mature pollock (Gudmundson et al., 2000; Zeppelin and Ream, 2006; Call and Ream, 2012), placing them in direct competition with the fishery and challenging this paradigm. There is thus a need to quantify prey consumption of fur seals, particularly as it relates to size-specific pollock consumption, to better understand the potential role of prey availability in the population decline and to inform fishery management. Our understanding of fur seal behavior and energetics has markedly improved since the early 1990s, allowing for the development of more accurate bioenergetic models that better characterize the energy intake and prey consumption of fur seals.
The goals of this study were to quantify energy intake and prey consumption by fur seals breeding on the Pribilof Islands, with a particular focus on estimating size-specific consumption of pollock. To do this, we developed individual bioenergetic models for each demographic group to estimate the individual- and population-level energy intake of northern fur seals. We combined estimates of energy intake with diet composition and prey energy density to estimate species-specific consumption and size-specific consumption of pollock during 5 of the 6 years that spanned 1995–2010. We compared size-specific pollock consumption estimates with estimates of pollock biomass and number of age-1 recruits from the stock assessment, commercial fishery catches, and consumption by the three predator species currently included in the CEATTLE model. These comparisons provide insight into how pollock consumption relates to estimated pollock abundance and the overlap between fur seals, the commercial fishery, and other pollock predators. By placing our results within the context of other Bering Sea predators, we highlight the importance of explicitly accounting for pollock mortality due to fur seal predation in pollock stock assessment models.
Materials and Methods
Fur Seal Life History and Foraging Behavior
The annual life cycle of a northern fur seal involves a migratory period of 6–8 months spent entirely at sea followed by the breeding season where animals come ashore to rest, socialize, and reproduce (Figure 1A). The exception to this is pups that disperse from their natal rookery after the approximate 4 month lactation period and may not return to land until they are 2-years-old, a conclusion based on the comparatively few yearlings that are observed on rookery and hauling grounds (Bigg, 1986). Arrival times on breeding islands vary with age, sex, and reproductive status, with adult males arriving first and juveniles last (Kenyon and Wilke, 1953; Bigg, 1986; Figure 1A). Age- and sex classes also segregate to some extent while on land (rookeries vs. hauling grounds), with more mixing of age classes on rookeries in late July and early August when adult males abandon their territories (Bigg, 1986). During the breeding season, seals intersperse periods spent onshore with foraging trips to sea. The duration of foraging trips and onshore visits is also sex- and age-specific, with lactating females exhibiting the shortest and most predictable foraging cycle compared with other groups due to reproductive constraints (Figure 1B). Departure from land on the annual migration typically occurs between October and December, and is again age- and sex-specific (Kenyon and Wilke, 1953; Zeppelin et al., 2019). Thus, while fur seals are generally present on the Pribilof Islands from May to December, the tenure of individual seals and groups is considerably less than this due to this sex- and age-specific variation in arrival and departure times.
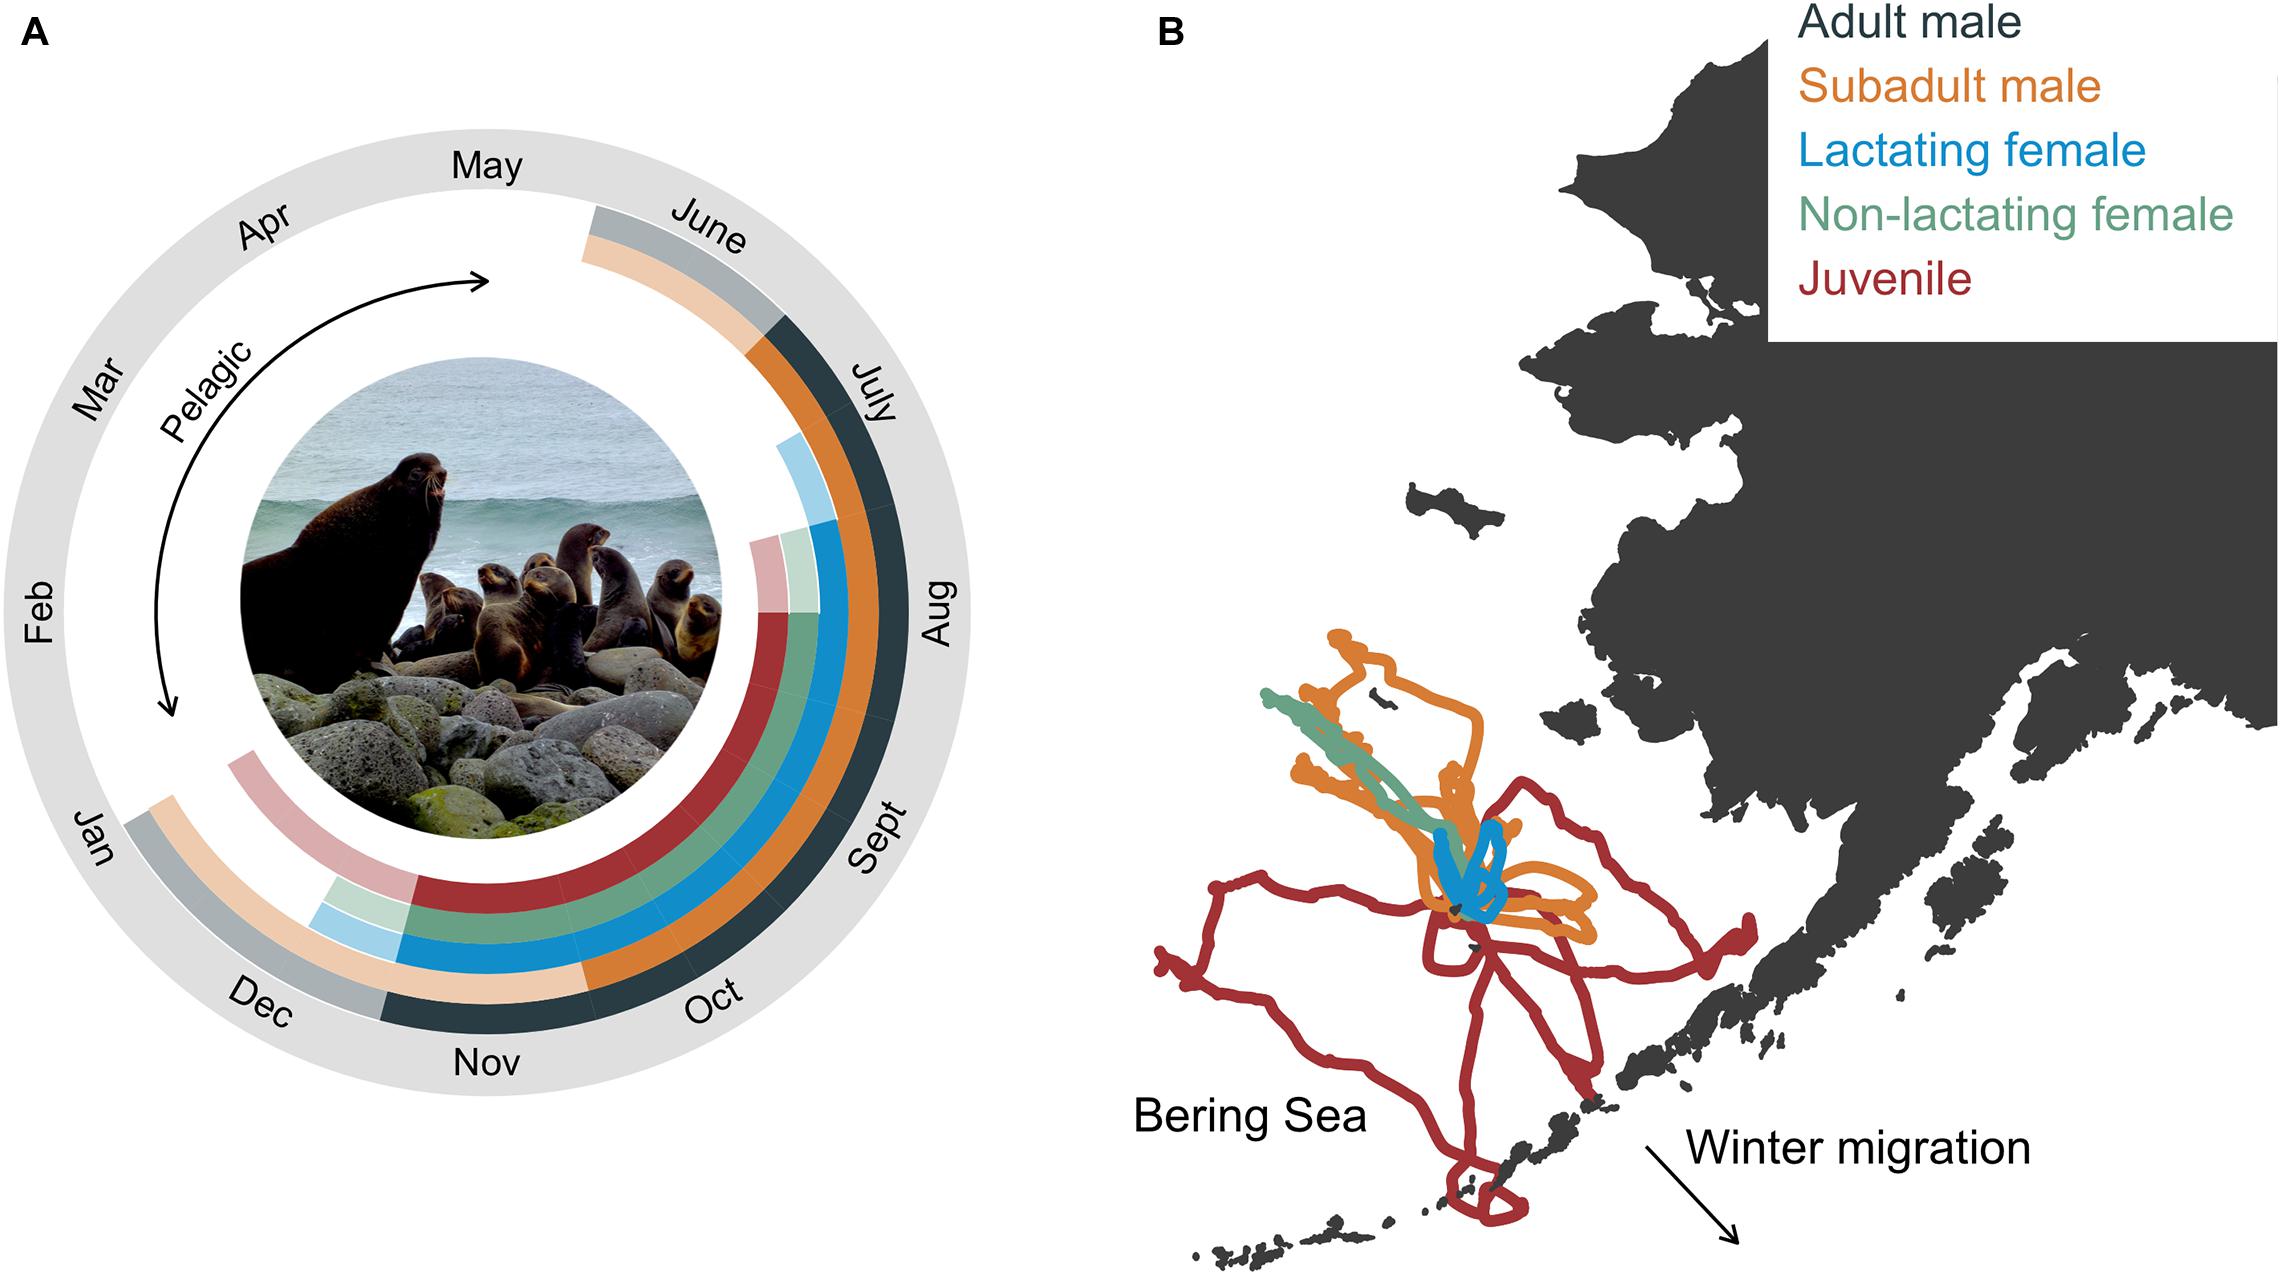
Figure 1. Annual life cycle of northern fur seals by group with inset photograph showing the size dimorphism between an adult male and lactating females (A) and example foraging trips from satellite telemetry of seals in each group (except adult males, B). In (A), solid colors correspond to the time between the mean arrival and departure time of seals in each group, representing the time when most fur seals in each age group were present in the bioenergetic model simulations. Transparent colors correspond to the time between the minimum allowable arrival and maximum departure dates, which in conjunction with the solid colors, represent the total allowable time fur seals in each age group were present in the bioenergetic model simulations. In (B), example foraging trips were from seals instrumented at the same rookery. Photograph by R. Ream (AFSC-MML).
Bioenergetic Model
We developed five separate bioenergetic models to accommodate known variation in energetic costs, behavior, body size, and life history among fur seals of different age-, sex-, and reproductive classes. These groups were as follows: adult males (age 8+ years), subadult males (age 4–7 years), lactating females (age 4+ years with pup), non-lactating females (age 4+ years with no pup), and juveniles (age 1–3 years). Within the juvenile and subadult male models, we further partitioned individual seals by age and sex (juveniles only) to accommodate differences in body size and arrival/departure times. We focused on estimating the energetic costs that fur seals experienced between the time of first arrival onshore in the Bering Sea to departure on their annual migration, regardless of the distance or final location of that migration (hereafter referred to as the non-migratory or breeding season). To do this, we simulated individual fur seals arriving in the Bering Sea followed by alternating periods of resting ashore with foraging trips to sea until the time of departure on the annual migration (Figure 2). Because the actual population size is unknown, the number of individual fur seals in each simulation was derived from 11 different population models to incorporate uncertainty into population-level estimates of fur seal energy intake (Supplementary Text, Figure 2 and Supplementary Figure S1), with separate simulations run for each population model. We focused on 6 years that spanned the current population decline (1995–1996, 2004–2006, 2010) based on availability of fur seal data and because these years encompassed a variety of environmental conditions, primarily as it related to the extent of the cold pool (Supplementary Figure S2).
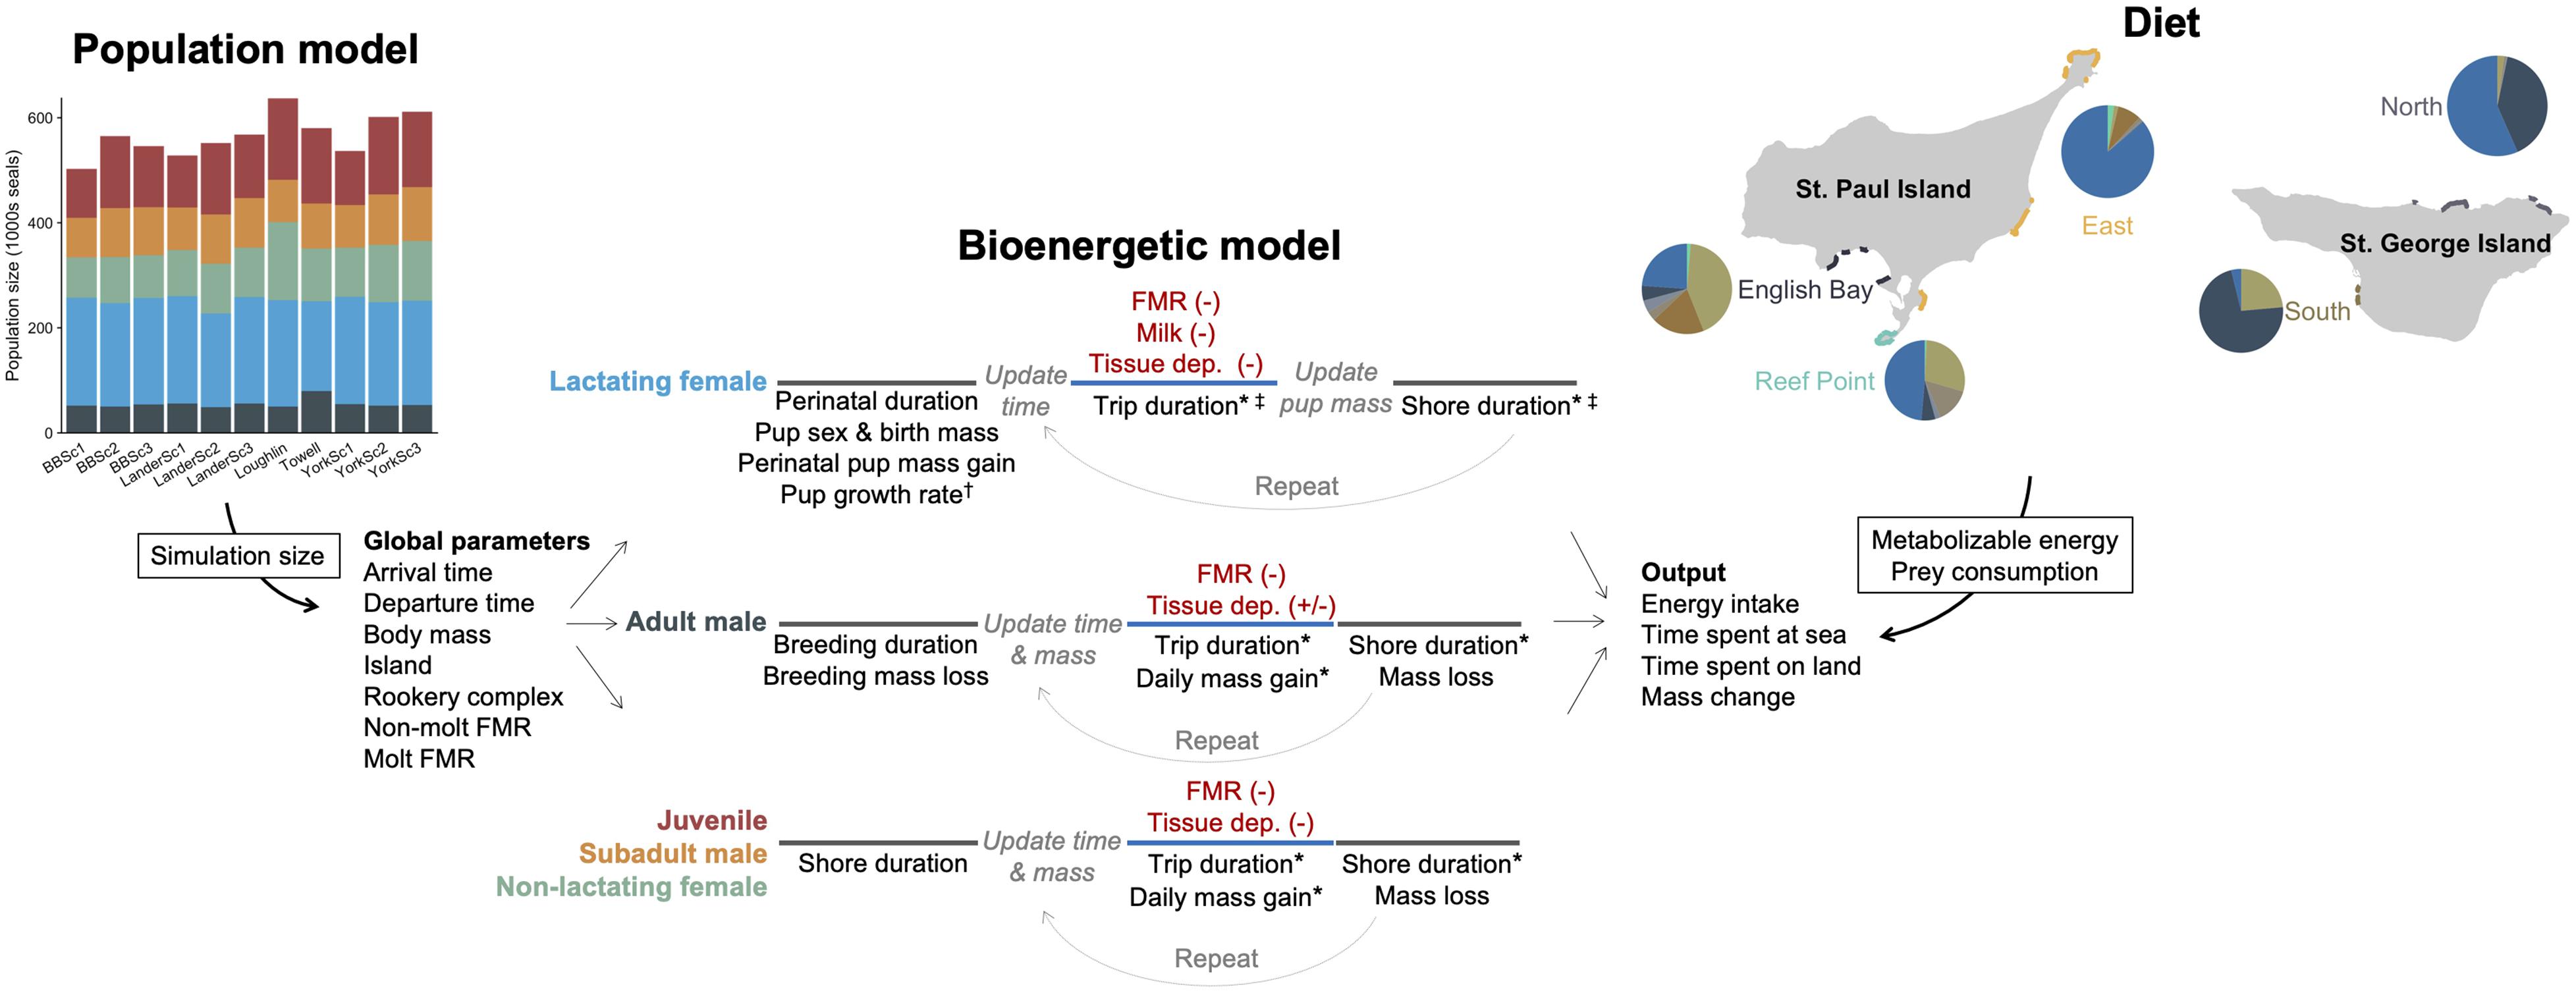
Figure 2. Schematic illustrating the general structure and parameters of the bioenergetic model simulations and how additional data streams (population model, diet) were incorporated to estimate energy and prey consumption of northern fur seals. In the bioenergetic model, black text represents individual parameters, red text represents energetic costs, and line colors correspond to time at sea (blue) or onshore (gray). Parameter values were held constant for an individual, allowed to vary across foraging trips (*), model years (†), or month and island within a year (‡). Energetic costs were met from prey (-) except when tissue catabolism offset energetic needs (+). In the population model, each column represents a different model, with colors corresponding to each fur seal group (shown for a single year). In the diet figure, pie graphs represent the percentage contribution by energy of different prey species to the diet of northern fur seals (shown for a single year) and are separated by rookery complex to illustrate spatial variation in diet composition. The size of pie graphs relates to the proportion of pups born at each rookery complex within each island, which was the variable used to assign individual seals to each rookery complex.
Models were parameterized using data specific to each group whenever possible, with values largely derived from studies conducted on the Pribilof Islands. To incorporate variability, parameter values were generally drawn from distributions that reflected the range of values exhibited by free-ranging fur seals. We were able to use year-specific values related to lactating female behavior (trip and shore durations) and reproduction (pup growth rates, lactation duration), which allowed us to quantify how natural interannual variability in these parameters affected energy intake of lactating females. For the remaining groups, parameter values were the same across all years due to data limitations. We describe the energetic costs included in the models and how they were parameterized below; a detailed description of parameterization of additional data used in simulations, such as arrival and departure times and trip and shore durations, can be found in Supplementary Text and Supplementary Tables S1–S6. The equations used to calculate the energy costs of an individual fur seal that are described in the following section are also in Supplementary Text.
Energetic Costs
Fur seals must acquire prey resources that balance energy expenditures within three categories: (1) field metabolic rate (FMR) that includes costs associated with metabolism, locomotion, thermoregulation, and digestion; (2) tissue deposition; and (3) lactation (adult females with a pup only). While FMR includes the energy an individual expends to capture prey for growth and lactation, it does not include the energy contained in the tissue (or milk) itself. These costs need to be modeled separately to accurately estimate energy intake and food consumption because individuals need to eat more than they expend to support these costs. We assumed that costs associated with skeletal growth were negligible and thus were not included in the model. The costs associated with pregnancy were not included in the model because implantation does not occur until early November around the time of weaning and departure of adult females from the Bering Sea (York and Scheffer, 1997).
Field metabolic rates were estimated differently for each group depending on data availability. For adult females, we used estimates derived from 48 free-ranging lactating northern fur seals during summer (July and August) and fall (September and October) using the doubly labeled water method (McHuron et al., 2019; Supplementary Table S1). These data were collected in 1995 and 1996, but values are largely similar to a more recent study of 20 lactating females conducted in 2011 (Jeanniard du Dot et al., 2018). We used the same values for lactating and non-lactating females given an absence of data for non-lactating females and evidence that fasting metabolic rates are unaffected by lactation status (Costa and Gentry, 1986; Costa and Trillmich, 1988). Separate values were used for summer (before September) and fall (September onward) because at-sea FMR was higher during fall, presumably due to increased metabolic costs associated with molting (McHuron et al., 2019). Several studies have examined resting metabolic rates (RMR) of captive juvenile fur seals (Dalton et al., 2015; Gomez et al., 2016), but measurements of FMR from free-ranging fur seals from this and other groups are lacking. As a result, we used the ratio between Kleiber estimates of basal metabolic rate (BMR; Kleiber, 1975) and at-sea FMR derived from the adult female data to determine the BMR multiplier for juveniles, subadults, and adult males, assuming that the seasonal differences in at-sea FMR were due to molt (non-molt: 4.87 times Kleiber, molt: 5.24, Supplementary Tables S2–S4).
The energy invested in tissue deposition (largely used to support energy costs while on land) was quantified for all groups, but the approach differed between adult females and the other three groups. For adult females, we calculated these costs based on the onshore duration following a foraging trip and the estimated onshore FMR (Supplementary Table S1). This assumes that adult females do not experience a net mass gain across the season, which is consistent with empirical observations of lactating females from St. Paul Island in 2005 and 2006 (Banks et al., 2006). For juveniles and subadult males, we used mass change estimates from captive Steller sea lions (Eumetopias jubatus, Calkins et al., 2013; Supplementary Table S2) and free-ranging fur seals (Sterling and Ream, 2004; Supplementary Table S3), respectively. These mass changes were coupled with a 3:1 fat:protein ratio for tissue growth derived from captive fur seals (Dalton et al., 2015) and the energy content of fat and protein (39.3 and 18.0 MJ kg–1, respectively; Kleiber, 1975; Schmidt-Nielsen, 1997; Supplementary Tables S2–S3). For adult males, we assumed a fat:protein ratio of 5:1 (Boyd and Duck, 1991), with daily mass changes at sea estimated from mass changes of captive fur seals (Supplementary Table S4). Because captive data indicated adult males lost mass during the summer and fall, the sum of tissue costs was subtracted from FMR when this value was negative. We did not include any other costs outside of the energy invested in the tissue itself, such as the cost of synthesizing or metabolizing tissue, as these costs are likely encompassed within our FMR measurement.
The cost of lactation was determined from empirical measurements of northern fur seal pup milk intake (Donohue et al., 2002), and more specifically from the relationship between pup mass and daily energy intake. Lactation costs for each foraging trip were calculated based on the simulated length of the foraging cycle (days at-sea + ashore) and the pup’s predicted mass at the end of the foraging trip (and start of nursing period), which was determined based on assigned growth rates (Supplementary Table S5) as described in Supplementary Text. As above, we did not include any costs associated with conversion of prey energy to fat stores and subsequent remobilization to milk because these costs (if any) are already included in the FMR measurement.
The energetic costs were summed across the model time period to estimate the total net energy intake by each simulated fur seal. The resulting values are less than actual (gross) intake because they do not account for energy lost through urinary and fecal excretion. Gross energy intake was calculated using random draws from mixed distributions of metabolizable energy (ME) to account for the fact that fur seals feed on a variety of prey species that vary in energetic content, which influences the amount of energy available for metabolism (Gomez et al., 2016). These distributions were year- and rookery complex-specific and were based on diet estimates and prey energy density (see “Diet Composition”). Daily estimates of energy consumption were calculated by dividing the total net or gross value across the model time period by the number of days spent at sea. We chose to calculate energy intake relative to days spent at sea (instead of total days) since this is a more accurate representation of fur seal behavior (i.e., they do not eat while on land). Error bars (± SD) around energy intake estimates for each group represents variability among individuals, whereas error bars around the population-level energy intake represents variability in population size estimates. We only provide qualitative discussion (and not statistical comparisons) of interannual variation in energy costs of lactating females and how they did (or did not) vary among eastern Bering Sea temperature regimes because of extremely small sample sizes (n = 3 per group), even for non-parametric statistics (Dwivedi et al., 2017).
Variation on Baseline Parameter Values
Because we parameterized the bioenergetic model using behavioral and reproductive parameters during the current population decline, the resulting estimates for lactating females do not necessarily reflect the energy intake needed to achieve the higher pup growth rates and wean masses characteristic of a population exhibiting healthy growth. We focus here on healthy growth (instead of a stable population) for two reasons: (1) to achieve the Conservation Plan for the Eastern Pacific Stock of re-designating northern fur seals as a non-depleted stock under the Marine Mammal Protection Act, the abundance of the stock would need to nearly double in population size, indicating the Pribilof population, particularly St. Paul, likely needs to exhibit considerable growth for this to occur (Muto et al., 2020), and (2) we generally lacked longitudinal measurements of pup growth rates from a stable population. We had pup growth rate measurements from 1995 to 1996 (two of our model years), but since the cause of the decline in pup production that began in 1998 is unknown, it is possible that the factors that contributed to this decline began several years prior to 1998.
To provide insight into the mechanisms that could lead to higher pup growth rates in the Pribilof Islands, we explored how variation in pup growth rates, trip durations, and metabolic rates altered estimates of energy intake by lactating females. In other words, these variations altered both the lactation component (by increasing the milk energy intake of the pup) and metabolic overhead of the female (by changing metabolic rates and/or reducing the proportion of time spent at sea). We included variation in metabolic rates because it has been suggested that female fur seals are currently operating at or close to their metabolic ceiling (McHuron et al., 2019), thus baseline metabolic rates may be higher than those of lactating fur seals from a growing population. This variation was included by running models where metabolic rates were 80, 90, and 100% of baseline values.
Parameter values for pup growth rates and trip/shore durations were derived from empirical measurements from Bogoslof Island, where the population is currently increasing (Muto et al., 2020), and historical estimates from the Pribilof Islands. For the first scenario (Bogoslof Island), we used pup growth rates and trip and shore distributions from satellite-tagged females in 2005 and 2006 at Bogoslof Island (Banks et al., 2006; Supplementary Table S7). For the second scenario (Historical Pribilof), we used the pup growth rates from Bogoslof Island (in the absence of pre-decline estimates from the Pribilof Islands) and trip and shore durations estimated from VHF tags (St. Paul) or visual observations of marked seals (St. George) during 1984 (Supplementary Table S7). The average pup growth rates at Bogoslof Island are within the maximum range exhibited by pups in the Pribilof Islands during our target years, indicating such high growth rates are achievable on the Pribilof Islands. Pre-decline estimates of trip and shore durations from the Pribilof Islands were not available, but August pup weights were high in 1984 and foraging distances of female fur seals were similar to those described from the late 1800s (Lucas, 1899; Kozloff, 1986). We included both scenarios because while we had good estimates of pup growth and maternal behavior from Bogoslof Island, we were concerned that maternal behavior of females from Bogoslof Island was not reflective of the population at the Pribilof Islands during the most recent periods of stable (1950s) or increasing growth (early 1900s). Trip durations at Bogloslof Island are exceptionally short, presumably because the foraging grounds are within 20–70 km of the rookery (Kuhn et al., 2014a). In contrast, pelagic sealing records indicated that the foraging grounds for Pribilof Island fur seals in the late 1800s were 120–240 km from the rookery (Lucas, 1899).
Sensitivity Analysis
We conducted a sensitivity analysis to examine the influence of uncertainty/variability in key parameters on the bioenergetic model output, focusing on lactating females since they provided the greatest range of parameter variation from the interannual estimates and Bogoslof and Historical Pribilof scenarios. Specifically, we examined the sensitivity of the total energy intake (summed across the season and all individuals) to population size, metabolic rate, lactation duration, trip and shore durations, pup growth rates, and metabolic efficiency. We used two metrics, the partial correlation coefficient and the semi-partial correlation coefficient, implemented using the pcc function in the R package sensitivity (Iooss et al., 2020). These metrics allowed us to assess the overall sensitivity of the model to each variable after accounting for the influence of all other variables on model output (partial correlation coefficient, pcc) and to examine the effect of each variable, free of the influence of any other variables (semi-partial correlation coefficient, spcc). The latter provided a rank of the influence of variables on model output (i.e., which variable had the strongest influence on energy intake).
Diet Composition
Scat (fecal) and spew (regurgitate) samples were collected at each of the five Pribilof Islands rookery complexes where distinct diets have previously been identified (Zeppelin and Ream, 2006; Figure 2 and Supplementary Table S8). Samples were collected from July to November in all years except 2005, with the majority of sample collection occurring in late August. Scat samples dominated the sample composition at all rookery complexes, with the exception of the two complexes at St. George Island in specific years (Supplementary Figure S3). Similar to Waite et al. (2012), we chose to pool both sample types in diet analyses because exclusion of spew samples can result in prey- and size-specific biases and an inaccurate representation of the diet (Gudmundson et al., 2000; Tollit et al., 2007). We recognize this could introduce bias if the frequency of scats and spews in our dataset did not reflect the natural occurrence on rookeries, but if present, would have minimal impact on prey consumption estimates because the majority of spews were collected at rookeries on St. George Island where the population size is small relative to St. Paul Island. We assumed that diet reconstruction from samples were representative of all fur seal groups, but in reality, they are likely biased toward adult females given sample collection occurred on rookeries where adult females are the dominate group and because adult males fast while holding territories (see section “Model Uncertainty” in “Discussion”).
Samples were rinsed through a series of nested sieves and prey hard parts (e.g., otoliths, squid beaks, bones) were identified to the lowest taxonomic level possible using identification guides and reference specimen collections at Pacific Identifications, Inc. (Victoria, British Columbia) and the Marine Mammal Laboratory. A subset of species or species groupings were selected for diet reconstructions based on their frequency of occurrence in samples (Supplementary Table S9).
The minimum number of individuals (MNI) of each of these prey species or groups was estimated by taking the maximum count of left or right otoliths (fish) or upper or lower beaks (squid) within each sample. When side could not be determined, MNI was calculated following Tollit et al. (2003).
A condition score was assigned to each otolith/beak that described the degree of erosion (good, fair, poor) following Tollit et al. (2004). Otolith lengths and squid beaks were graded based on condition and those in “good” or “fair” condition were measured to the nearest 0.1 mm using hand-held digital calipers or a stereo microscope eyepiece reticle. Species-and condition-specific digestion correction factors (DCFs) were applied to all otolith and beak measurements in fair condition to account for partial digestion of these structures (Supplementary Table S10). Species-specific regression equations were used to estimate prey size and mass from otolith and beak measurements (Supplementary Table S11 and Supplementary Figures S4, S5). In the absence of species-specific DCFs and equations, we used similar or related species as proxies. While the majority of prey items in each sample were of sufficient condition to be measured, there remained enumerated prey that lacked measurement data (Supplementary Figure S6). In addition, in 1995 and 1996 some of the pollock otoliths were assigned to one of seven fork length bins (2–4, 5–13.4, 13.5–19.4, 19.5–29.4, 29.5–36.4, 36.5–41.4, and 41.4+ cm) instead of being measured. The mass of these prey items was estimated using the criteria shown in Supplementary Figure S7.
We used estimates of MNI and prey mass in a Variable Biomass Reconstruction (VBR) model to reconstruct the diet of northern fur seals at each rookery complex in our target years (Joy et al., 2006; Supplementary Figure S8). This model pools prey across all samples, thereby allowing individual samples to contribute variable weights to the overall total biomass of each prey species. While all diet reconstruction approaches have strengths and weaknesses, captive studies have generally shown that the VBR model is reliable in reconstructing actual diets of pinnipeds (Tollit et al., 2007; Phillips and Harvey, 2009; Sweeney and Harvey, 2011). Species- and size-specific numerical correction factors (NCFs) were applied to the mass estimate of each prey item in scat samples to account for complete digestion of some prey; similar species were used as proxies in the absence of species-specific data (Supplementary Table S12). NCFs were not applied to prey items from spews as these tend to be comprised of larger individuals (Gudmundson et al., 2000) and thus we assumed complete digestion was unlikely. Each species or species groups was treated separately in the diet reconstructions, with further separation of pollock, squid, and salmonids into size classes due to large variation in the mass of prey items consumed. These were subsequently recombined after analysis into the following species or species groups for ease of interpretation and visual presentation: hexagrammids/anoplopomatids, northern smoothtongue (Leuroglossus schmidti), Pacific herring (Clupea pallasii), Pacific sand lance (Ammodytes hexapterus), salmonids, squid, and walleye pollock. As mentioned previously, year- and rookery complex-specific estimates of diet composition by biomass were used to estimate metabolizable energy and therefore gross energy intake (Supplementary Figure S9). In 2005, we used the average rookery-specific diet composition in the absence of diet estimates.
We also reconstructed the diet as a function of energy composition, replacing the weight term in the VBR model with energy using energy density estimates of prey to convert biomass to energy (Supplementary Table S13). This avoided the assumption that diet composition by biomass was the same as energy when coupling the bioenergetic model output, which is in units of energy, with the diet composition data. The energy reconstruction diet estimates were broadly similar to those from the biomass reconstructions, but unsurprisingly, gave greater weight to energy-rich prey species (Supplementary Figure S8). We calculated 95% confidence intervals (CI) around point estimates of diet composition by energy using bootstrap resampling methods, repeating the calculations 1,000 times from n random sample draws with replacement from the total number of samples (n; Supplementary Table S14). We also calculated diet composition by energy using different DCFs for some species (Supplementary Table S10) and without NCFs to show how potential uncertainty in these values might have affected our diet composition estimates. The results of these analyses are shown in Supplementary Figures S10–S12 but were not used in further analyses.
Prey Consumption
Year- and rookery-specific gross energy requirements from the bioenergetic models were summed across all age classes and combined with year- and rookery complex-specific estimates of diet composition by energy. The resulting estimates of energy consumption for each prey taxon (and size groups within select taxon) were summed across all rookery complexes and then combined with prey energy densities to estimate the total prey biomass consumed by fur seals in each year. For pollock, we also present size-specific consumption in each year using the previously mentioned size bins. There were 11 estimates of prey consumption per year (one for each population model), which were then averaged to create a single estimate per year. We used the bootstrapped samples to estimate the variation around prey consumption estimates for each population scenario and then took the 95% CI from all population estimates combined. These CI thus incorporate uncertainty in diet due to sample effects and population size. We did not estimate prey consumption in 2005 because diet data were not available for this year.
The abundance of pollock in the eastern Bering Sea was assessed using age-3+ pollock biomass and age-1 recruitment from the 2019 stock assessment model (Ianelli et al., 2019). Age-specific pollock consumption by cannibalistic adult pollock, arrowtooth flounder, and Pacific cod were extracted from the multispecies stock assessment model described in Holsman et al. (2016), with updated 2019 results (Holsman et al., 2019). Fur seal pollock consumption was compared with fishery catches from the eastern Bering Sea during the B Season (Ianelli et al., 2019). Given our estimates of fur seal consumption were limited to 5 years, we only provide qualitative comparisons with these datasets.
All simulations and analyses were run using R v.4.0.3 (R Core Team, 2020).
Results
The average daily net energy intake of lactating females was 43.4 ± 5.4 MJ sea-day–1, which was 1.76 times higher than that of non-lactating adult females (Table 1). This value varied across lactation due to increasing pup milk demands and to a lesser extent increases in trip duration and metabolic rates. Lactation comprised an average of 37.5% of a female’s total energy budget, with male pups costing slightly more than female pups because of differences in birth mass and growth rates (38.8 vs. 36.3%). The average daily net energy intake of the remaining demographic groups ranged from 18.9 ± 3.1 MJ sea-day–1 (juveniles, age 1–3 years) to 66.0 ± 12.9 MJ sea-day–1 (adult males, 8+ years; Table 1). Total net energy intake across the entire foraging season ranged from 1,409.4 ± 647.1 MJ for juveniles to 7,651.7 ± 2,339.6 MJ for adult males (Table 1). Gross energy intake estimates were on average 21% higher than net estimates, with slight variation among years in mean metabolizable energy estimates due to dietary variation (0.81–0.84, Table 2). Energy intake to support growth and/or metabolism on land was highest for subadult males (38.3% of total energy intake), followed by juveniles (20.3%), lactating females (8.6%), and non-lactating adult females (4.1%). In contrast, energy intake by adult males was often less than estimated metabolic demands at sea, with an average of 9.0% of at-sea FMR met from tissue catabolism. Adult males, subadult males, and juveniles lost a net average of 41.8, 10.3, and 3.5 kg between the time of departure on their first foraging trip to their final departure from the Pribilof Islands, respectively. For juveniles and subadult males, this net loss occurred despite mass gains on individual foraging trips because of the amount of time spent fasting on shore following trips.
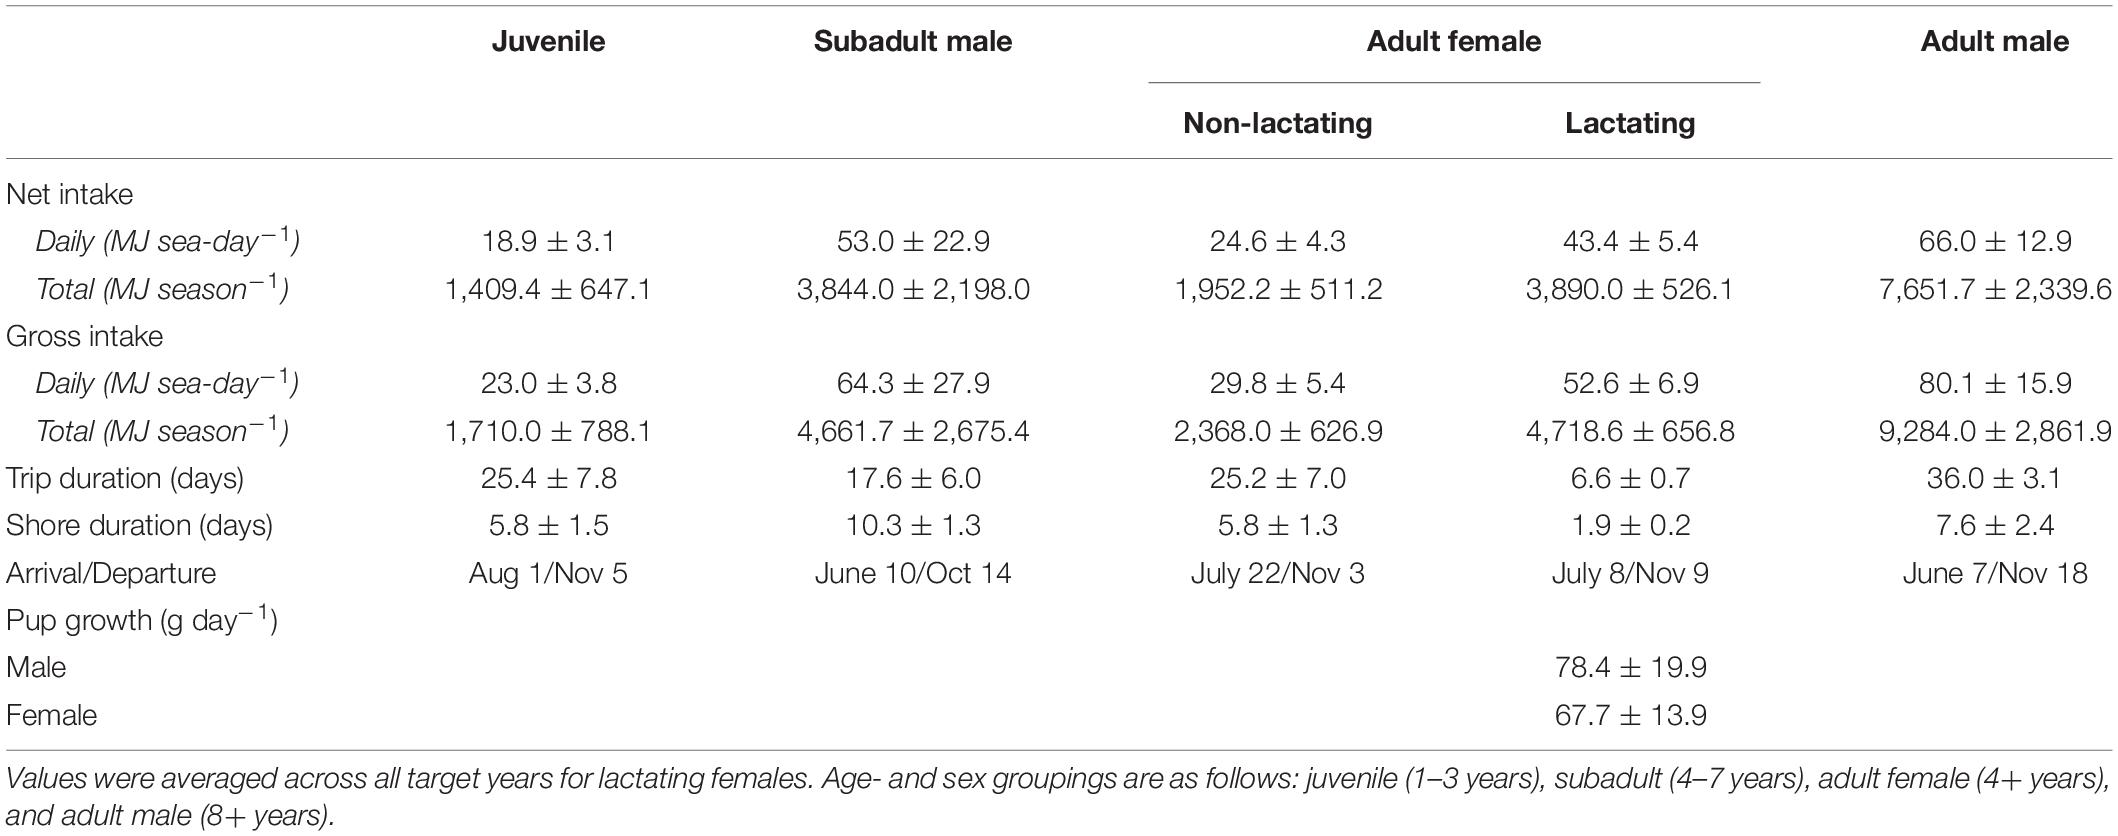
Table 1. Summary statistics from the bioenergetic model simulations, including the mean (± SD) net and gross energy intake, trip duration, shore duration, arrival and departure dates in the Bering Sea, and pup growth rates.
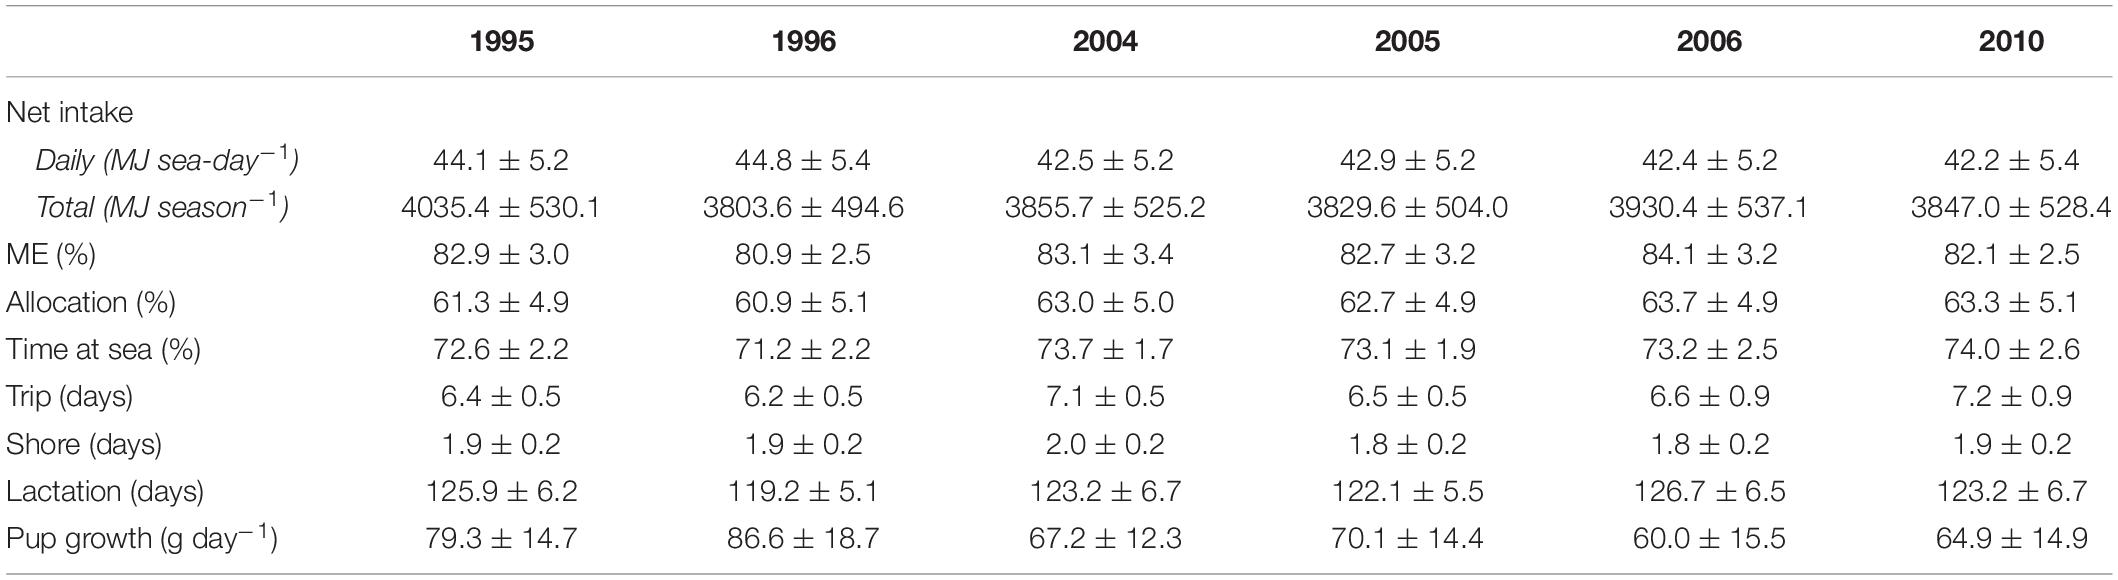
Table 2. Summary of bioenergetic model simulations for lactating females in each year, including mean (±SD) net energy intake, percentage of energy intake available for metabolism (ME), percentage of total energy intake allocated to a female’s metabolic overhead (Allocation), percentage time at sea, trip, shore, and lactation durations, and pup growth rates.
Annual variation in energy intake associated with changes in behavioral and reproductive parameters of lactating females were within 4% of the average energy intake across all target years (Table 2). There were no apparent trends in energy intake associated with warm vs. cold years; daily net energy intake was highest in 1995 (a cold year) and 1996 (a warm year) but this did not necessarily result in higher total net seasonal intake (Table 2). Lactating females spent from 60.9 to 63.7% of their total energy intake on their own metabolic costs. Mean pup growth rates were highest in 1996 (86.6 g day–1) and lowest in 2006 (60.0 g day–1); females invested 4.3% (per season), 10.9% (per lactation day), and 2.0% (per shore day) more energy on pups in 1996 compared with 2006.
Energy intake was higher under the Historical Pribilof and Bogoslof scenarios compared with current estimates, at least when metabolic rates remained unchanged (Table 3). Females in the Bogoslof scenario spent an average of 61.4% (2005) and 63.8% (2006) of their time at sea, resulting in daily net energy intake estimates that were 20.5% (2005, 51.7 MJ sea-day–1) and 19.6% (2006, 50.7 MJ sea-day–1) higher than estimates for the Pribilof Islands population in 2005 (42.9 MJ sea-day–1) and 2006 (42.4 MJ sea-day–1). Females in the Historical Pribilof scenario spent an average of 71.0% of their time at sea, with daily net energy intake estimates that were 2.2–9.8% higher than current estimates. Energy intake generally fell below current estimates if metabolic rates were assumed to be 90 or 80% of the rates exhibited by the current Pribilof Islands population. The exception to this was daily net energy intake of females in the Bogoslof scenario that remained high despite reductions in metabolic rates (Table 3).
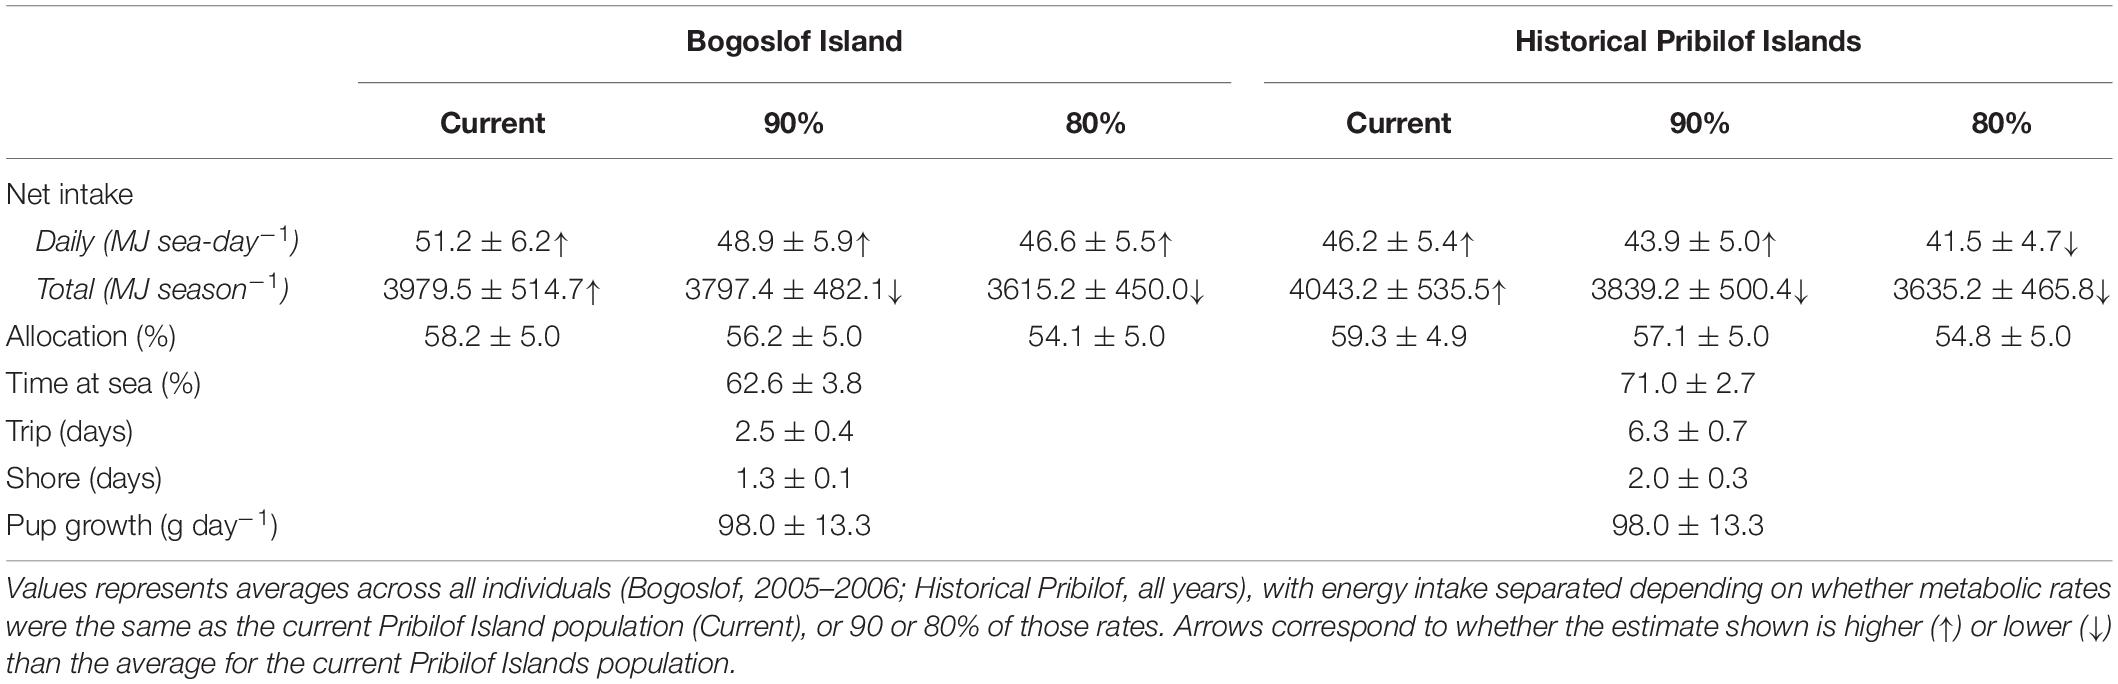
Table 3. Summary of bioenergetic model simulations for the Bogoslof and Historical Pribilof scenarios, including mean (± SD) net energy intake, the percentage of total net energy intake allocated to a female’s metabolic overhead (Allocation), percentage time at sea, trip and shore durations, and pup growth rates.
The gross energy intake of the entire Pribilof Island fur seal population per year (mean ± SD) ranged from 1,391,344 ± 186,079 GJ to 2,329,593 ± 93,927 GJ (Figure 3A). Population-level gross energy intake declined across the target years, consistent with the decreasing population size. Lactating females comprised the largest proportion of this intake (39.4%), followed by adult males (22.4%), subadult males (17.9%), non-lactating females (10.6%), and juveniles (9.7%). The sensitivity analyses indicted that population size (rpcc > 0.99), metabolic rate (rpcc = 0.97), lactation duration (rpcc = 0.78), and pup growth rate (rpcc = 0.46) all influenced the population-level energy intake of lactating females, but that population size was the most influential of these variables (rspcc = 0.79) followed by metabolic rate (rspcc = 0.18; Supplementary Table S15).
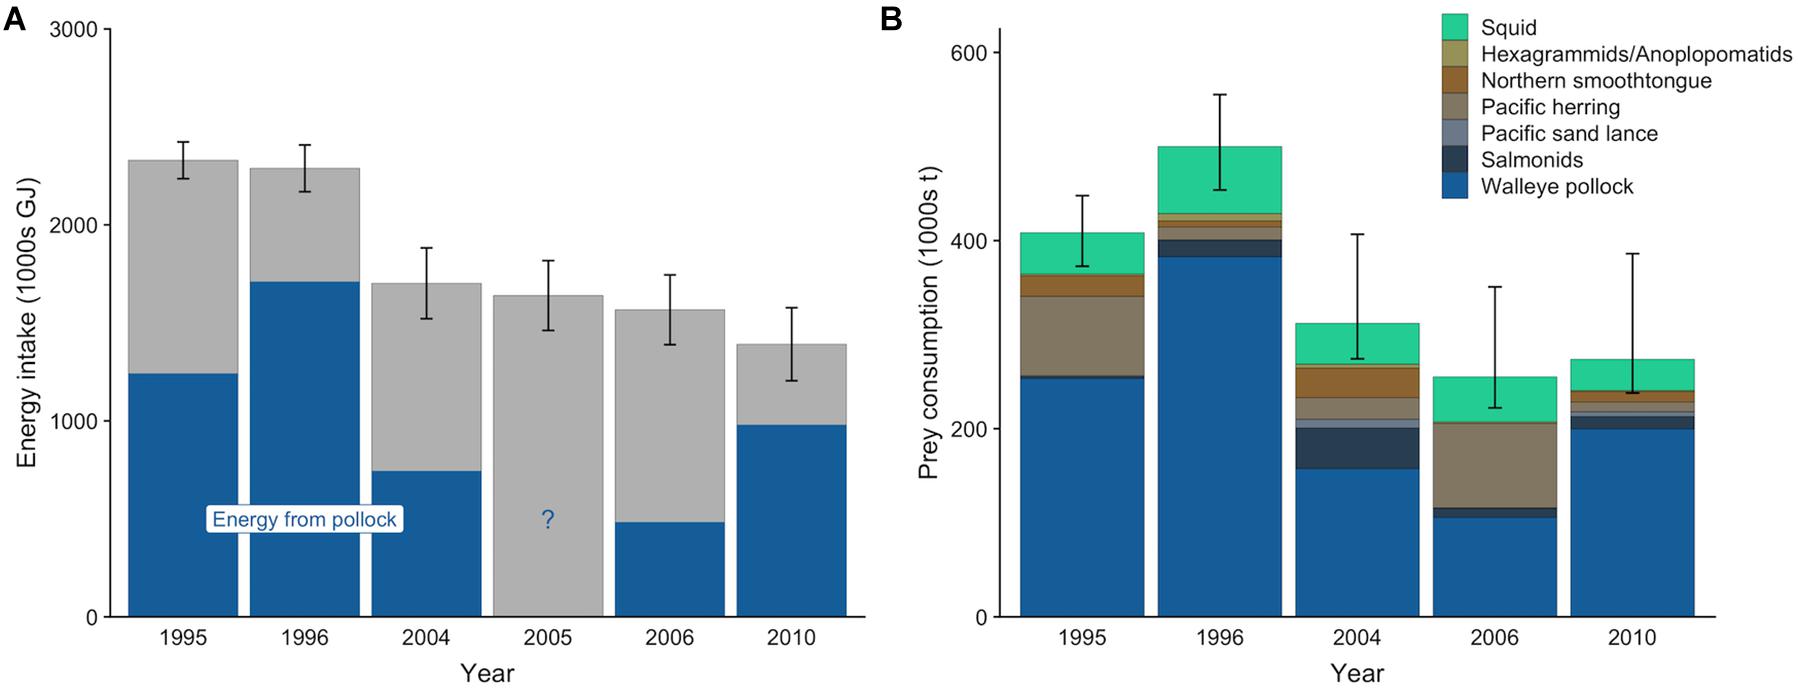
Figure 3. Mean energy intake (A) and prey consumption (B) by northern fur seals from the Pribilof Islands from May to December. In (A), the blue denotes the mean contribution of walleye pollock to the total energy intake for years where diet estimates were available. In (B), prey from similar species or type (squid) were combined into a single prey category for ease of visualization. Error bars are standard deviations that represent the uncertainty in the actual population size (A) or 95% confidence intervals that represent uncertainty in diet estimates and population size (B).
Mean estimates (95% CI) of total prey consumption ranged from 255,232 t (222,159–350,755 t) in 2006 to 500,093 t (453,720–555,205 t) in 1996 (Figure 3B). Across all years, pollock comprised the greatest proportion of prey biomass consumed, ranging from an average of 41.4% in 2006 to 76.5% in 1996. Squid contributed less to the overall prey consumption estimate than pollock, but it was present in all years in relatively consistent proportions. The relative contributions of other species varied among years, with Pacific herring increasing in 1995 and 2006, northern smoothtongue increasing in 1995 and 2004, and salmonids increasing in 2004 (Figure 3B).
There was interannual variation in the contribution of pollock size classes to the total pollock biomass consumed by fur seals (Figure 4A). For example, juvenile pollock (<19.5 cm fork length, age-0 and age-1) comprised 63.2% of pollock biomass consumption in 1996 but only 16.6% in 2004. This variation generally coincided with the number of age-1 recruits estimated from the stock assessment. For example, age-1 recruitment of pollock was above average in 1996 and 1997 but very low in 2004 and 2005 (Figure 4B), indicating age-0 and age-1 fish were likely abundant in 1996 but not in 2004. Fur seals consumed similar or greater quantities of pollock as adult pollock, arrowtooth flounder, and Pacific cod in all years except 2010 (Figure 5A). There was overlap in the age classes consumed, but fur seals consumed more mature (>29.4 cm, age-3+) pollock than the three fish predators (Figure 5B). Fur seal consumption of mature pollock was on average 17.3% of the B Season fishery removal from the eastern Bering Sea, with values for individual years ranging from 4.7 to 26.6%.
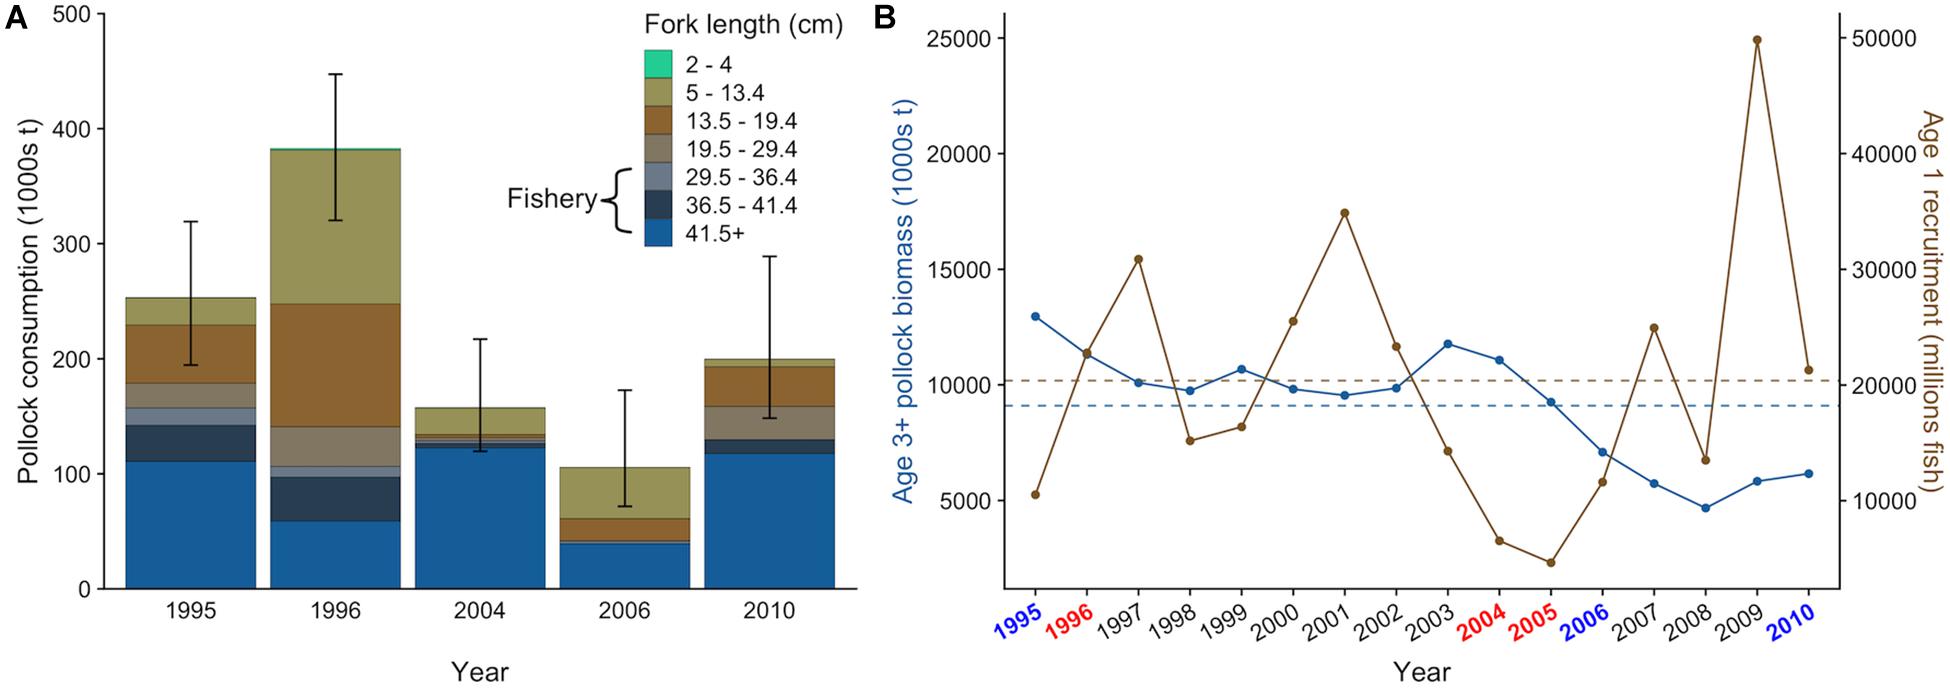
Figure 4. Size-specific walleye pollock consumption by northern fur seals from the Pribilof Islands with 95% confidence intervals that incorporate uncertainty in diet and population size estimates (A) and actual (points) and average (dashed lines) biomass of age-3+ pollock and age-1 recruitment in the eastern Bering Sea from 1995 to 2010 estimated from the 2019 stock assessment (B). In (A), the approximate size range of pollock targeted by the fishery is highlighted. In (B), target years are colored based on their general classification as “warm” (red) or “cold” (blue) based on bottom water temperatures measured on the eastern Bering Sea shelf in June and July.
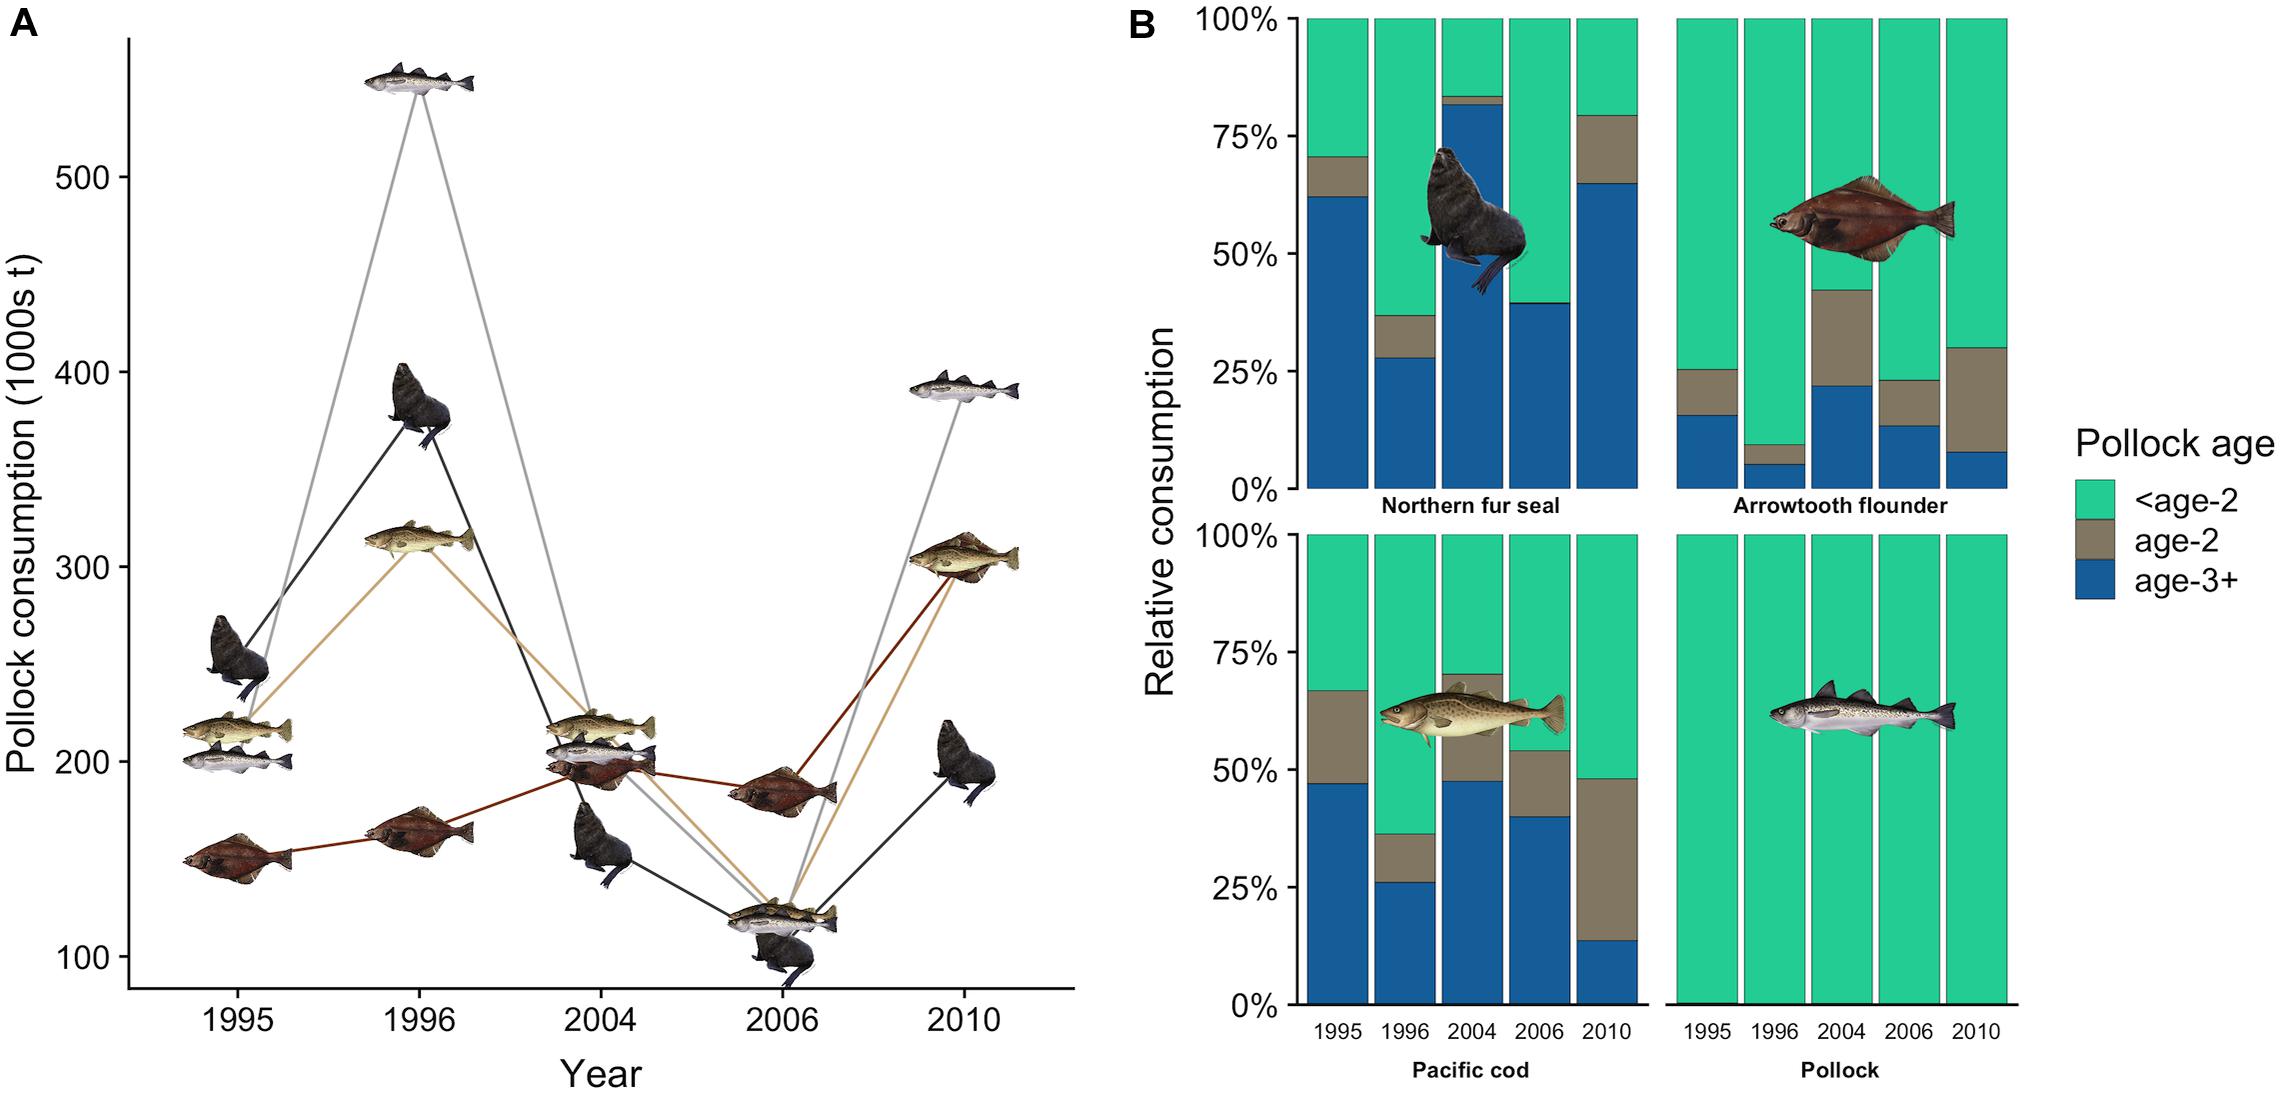
Figure 5. Total estimated consumption of walleye pollock by northern fur seals, pollock, arrowtooth flounder, and Pacific cod in each year (A), and the percentage contribution of pollock age classes to each predator’s consumption (B). In (B), pollock age estimates for fish predators were derived from the multispecies CEATTLE model (Holsman et al., 2016, 2019). Age-specific consumption of pollock by fur seals was based on fork length size classes: <age-2 (2.0–19.4 cm), age-2 (19.5–29.4 cm), and age-3+ (>29.4 cm).
Discussion
Energy Intake and Prey Consumption of Population
The wealth of available data for northern fur seals allowed us to create separate bioenergetic models for each demographic group that capture the natural behavior of this species during the majority of their time in the eastern Bering Sea. While there has long been interest in quantifying the amount of prey consumed by northern fur seals, there has surprisingly been no concerted effort to do so since the population began declining in the late-1990s (Supplementary Table S16). There have been a number of energetic studies aimed at better understanding the role of prey availability in the population decline, such as quantification of metabolic rates (Dalton et al., 2015; McHuron et al., 2019) and energy assimilation (Gomez et al., 2016), and much of these data were instrumental in this study. Our study provides a much-needed update from pre-decline consumption estimates, although it should be noted that our estimates are now a decade old. As of 2018, the average number of non-pups in the Pribilof Islands population was 282,946 seals, a reduction of 18.5% from the population size in our last target year (2010). Thus, the prey consumption of the current population is likely to be considerably less than 2010 estimates, particularly given the influential nature of population size on the population-level energy intake.
Fur seals consumed an average of 9.8–25.6% of their body weight in prey per day at sea during our target years (based on an average prey energy density of 5.4 MJ kg–1), with the lowest estimates for adult males and the highest for lactating females. These values generally exceeded those used in previous fur seal bioenergetic modeling efforts that were derived from captive seals (6–8% day–1), even after adjusting for discrepancies in the measurement interval (sea-day–1 vs. day–1). Our estimates are, however, within maximum consumption rates of this species (Rosen et al., 2012) and similar to estimates for lactating fur seals based on stomach contents (26% sea-day–1; Perez and Mooney, 1986) and juvenile fur seals based on metabolic rates at water temperatures of 5°C (14% day–1; Miller, 1978). While not particularly surprising, these differences between consumption estimates of captive and wild seals reaffirm that bioenergetic models may underestimate energy requirements of wild populations when based on food intake rates of captive animals (Miller, 1978; Winship et al., 2006), particularly during energetically expensive life history events. The large variation in age- and sex-specific consumption estimates underscores the importance of developing individual bioenergetic models when there is considerable variation in factors likely to influence energy intake (e.g., body size, energetic costs, behavior), as is the case for northern fur seals.
The population of northern fur seals breeding in the Pribilof Islands consumed an estimated 255,232–500,093 t (95% CI range, 222,159–555,205 t) of prey in our target years, with lower estimates in more recent years due to the population decline. Our estimates generally exceeded historical estimates (Supplementary Table S16), suggesting that the ecological impact of fur seals in the Bering Sea and potential interactions with the commercial pollock fishery have likely been vastly underestimated. For example, the fur seal population in the 1960s–1970s was estimated to consume between 304,000 and 379,700 t of prey between June and November (Sanger, 1974; McAlister and Perez, 1977) despite a total population size that was over 50% greater than in our target years. These underestimates are likely due to the fact that daily prey consumption in many historical studies were assumed to be 6–8% of body mass regardless of age- or sex class. It is important to highlight that our estimates do not include prey consumed by weaned pups or other age groups once they depart from the Pribilof Islands on their annual migration but remain in the Bering Sea for a period of time (Ream et al., 2005; Lea et al., 2009; Zeppelin et al., 2019). Prey availability during this time period may be critical for newly weaned pups and post-lactation females, and quantifying energy needs during this time remains an important next step (Trites, 1992). Currently, the majority of fur seals leave the Bering Sea by February (Zeppelin et al., 2019), but this could change in response to environmental changes that affect prey spatial distributions and allow fur seals year-round access to previously inaccessible areas (Stabeno and Bell, 2019; Stevenson and Lauth, 2019).
Pollock played an integral role in meeting the energy needs of fur seals, with a greater dependence on mature pollock during years when juvenile pollock were less abundant. The importance of fishery-sized pollock to northern fur seals to date has been largely overlooked, but our results suggest that they may play a critical role in meeting energy needs during poor-recruitment years. Temporal variation in age-specific pollock consumption has also been linked with changes in the abundance of young pollock for Steller sea lions (Tollit et al., 2015), but further analyses that include additional diet data and a broad suite of environmental and biological variables that characterize the local conditions for each rookery complex are needed to better understand the mechanisms driving variation in age-specific pollock consumption. The magnitude of pollock consumption by fur seals rivaled that of other Bering Sea fish predators, indicating that they represent a significant source of mortality for pollock and should be explicitly included in multispecies stock assessment models.
Although pollock was the dominant prey, squid, herring, northern smoothtongue, and salmonids all contributed to at least 5% of the population’s prey biomass consumption in at least one of the target years. This broad pattern obscures fine-scale spatial variation in prey consumption because it is strongly driven by the number of fur seals using each rookery complex and as such, is not necessarily representative of the relative importance of each prey species at individual complexes. Temporal variation in the importance of prey species likely reflected availability given that fur seals are opportunistic foragers (Kajimura, 1984). Diet variation from groundfish and seabirds in the Bering Sea during our study years exhibited similar trends (Lang et al., 2003; Kokubun et al., 2010; Renner et al., 2012), further supporting this conclusion. Alternative prey resources likely play a critical role in years when pollock are less available and may become increasingly important to fur seals given projected declines of pollock under future climate conditions (Mueter et al., 2011; Spencer et al., 2016).
Lactating females comprised the greatest proportion of the population’s energy intake, which resulted from the high cost of lactation and because they constituted an average of 33.8% of the population size. We estimated that lactating females consumed 1.7–1.8 times more energy than non-lactating females, which is similar to the 1.6 estimated by Perez and Mooney (1986) based on stomach contents of northern fur seals taken pelagically from 1958 to 1974. This resulted in greater consumption rates per day at sea (relative to body mass) than what has been estimated for other otariids (Winship et al., 2002, 2006; McHuron et al., 2017), in part because of their small body size. In addition to being one of the smallest otariids, northern fur seals have one of the shortest lactation periods (Schulz and Bowen, 2004), the combination of which likely make them particularly susceptible to changes in prey availability. There was interannual variability in female behavior and pup growth rates during our target years that resulted in slight changes in estimates of daily energy intake. The highest estimates occurred in 1995 and 1996, the 2 years when pup growth rates were highest and trip durations were the shortest. There were no apparent patterns with respect to eastern Bering Sea temperature regime (warm vs. cold years) for either daily or total energy intake. There was relatively little interannual variation in total energy intake across the entire season, likely due to a small range of lactation durations (119–127 days) and because the metabolic overhead of females was reduced during years of higher pup growth rates due to shorter trip durations. These findings are consistent with those of Arnould (1997), who found that Antarctic fur seals (Arctocephalus gazella) experienced similar total energy expenditure across 2 years that contrasted in prey availability and milk energy expenditure, indicating that changes in energy allocation can be the sole driver of reduced pup growth rates during periods of low prey availability.
Adult males were the second greatest contributor to the population energy consumption despite comprising only about 9.8% of the total population size. The disproportionate influence of males was due to the combination of extreme size dimorphism and the long tenure of adult males in the Bering Sea compared with other groups. This finding should be considered preliminary because we had very limited empirical data for which to parameterize the model, particularly with respect to how much foraging occurs. Adult males are the first demographic group to arrive in the Bering Sea, but much of the initial time is spent fasting on land when males are actively holding or attempting to hold territories (Gentry, 1998). Their behavior upon desertion of their territories is largely unknown, but foraging undoubtedly occurs given males can remain in the Bering Sea until December or later (Kenyon and Wilke, 1953; Zeppelin et al., 2019). Peterson (1965) found that 8 of 15 males returned to the spot they held territory approximately 2–4 weeks after desertion, which aligns with observations by pelagic sealers that adult males were common in the Bering Sea during August and early September (Fiscus et al., 1964). Our current estimates indicate that adult males can be significant contributors to the population’s energy consumption even when limited foraging occurs, but more data are needed on their behavior and mass changes at sea to better quantify the ecological importance of this group. Further investigation into adult male vital rates and observability during the breeding season is also warranted, as this would help reduce the uncertainty in the size of this group among different population models and life tables.
Model Uncertainty
There remains uncertainty in our energy and prey consumption estimates despite efforts to incorporate known individual variation in parameter estimates and uncertainty in diet and population size estimates. In particular, we lacked estimates of FMR from most groups and as discussed previously, had limited data to parameterize the adult male model. While our metabolic parameters appear reasonable given comparisons with estimates of resting-, standard-, and active metabolic rates of captive fur seals (Dalton et al., 2015; Ladds et al., 2017a,b), future efforts that better capture at-sea behaviors of free-ranging fur seals are warranted due to the influential nature of metabolic parameters on bioenergetic model output, as indicated by the sensitivity analysis and other efforts (Winship et al., 2002; Bejarano et al., 2017). Diet reconstructions from prey hard parts remain another source of uncertainty because of inherent methodological and introduced biases associated with sampling, which are discussed in further detail below.
Differential digestion and passage rates among prey is a known bias when using scat samples for diet reconstructions (reviewed in Bowen and Iverson, 2013). The use of correction factors and hard parts other than otoliths/beaks can help minimize this bias, which are typically derived from animals in captive settings. We applied both DCFs and NCFs, but these values were derived from other otariids (primarily Steller sea lions) and we did not have species-specific correction factors available for every prey species. While the derivation of these correction factors for northern fur seals remains important, our sensitivity analyses indicated that the DCFs and NCFs we used likely provided conservative estimates of pollock consumption. We did not use other prey hard parts in diet reconstructions, primarily due to the challenges associated with quantifying MNI using other hard parts (e.g., teeth, gill rakers) and because measurements from other structures were not available in most of our target years. For most prey groups, occurrence of their otoliths or beaks was representative of their overall occurrence based on all hard parts, but this method likely led to the underrepresentation of at least one species group in diet estimates. For example, we identified salmonid bones in samples where no otoliths were present (Supplementary Figure S13), suggesting that NCFs are likely insufficient to overcome this bias because at least one prey item needs to be present for it to be applied. Additional detailed quantitative hard parts data for known prey species (Zeppelin et al., 2004) and the inclusion of complementary diet methods (Tollit et al., 2017; Nielsen et al., 2018) would aid in resolving these issues and improve future diet reconstruction estimates for northern fur seals.
There were also several issues associated with the timing, location, and effort of sample collection that may have introduced bias or otherwise led to uncertainty in diet estimates. Sample collection primarily occurred in August, which is problematic if there was temporal variation in the availability of some species. Based on stomach samples collected from 1954 to 1972, Kajimura (1984) found that while pollock remained the most important prey item across key months of the breeding season (July–September), the importance of other species varied among months. Notably, herring was present in all months but importance peaked in August (Kajimura, 1984), indicating that our average estimates of herring consumption may be an overestimate. This bias is unlikely to be completely captured by the 95% CI because there were only 60% of years/complexes where samples were also collected in other months. The location of sample collection also likely biased diet reconstructions toward adult females as previously mentioned. The diet of juvenile and subadult males is broadly similar to that of lactating females (Kiyota et al., 1999; Call and Ream, 2012), albeit with slight size-specific differences in prey consumption, but there have been no diet studies of adult males. Future studies examining sex- and age-specific variation in diet are important given that ongoing environmental changes in the Bering Sea may lead to greater disparity in diet between lactating females and other groups that are less constrained in their foraging behavior. Lastly, while we generally had good sample coverage, there were some rookery complexes where the number of samples was considerably less than recommended (Trites and Joy, 2005), particularly in 2010. The fact that we selected prey species with high frequencies of occurrence and detected known spatial trends in fur seal diet suggests that this issue, while important to acknowledge, may have been less influential on our results than other sources of uncertainty.
Mechanisms to Increase Pup Growth
Northern fur seals have two primary mechanisms by which to increase their foraging efficiency and therefore the amount of energy available for lactation. We explored the influence of these mechanisms on energy intake using the Historical Pribilof and Bogoslof scenarios to better understand the conditions that might lead to increased pup growth rates in the current Pribilof population. When foraging effort (metabolic rate) was held constant, average daily net energy intake increased by 6.6% (Historical Pribilof) or 18.2% (Bogoslof), which could theoretically be met by increasing prey consumption or switching to more energy-rich prey. These seem unlikely avenues for fur seals in the Pribilof Islands for two reasons: (1) the similarity between current consumption estimates and those in the 1960s and 1970s suggests that females may have limited flexibility to physically increase prey consumption, even if additional prey were readily available, and (2) energy-rich species were inconsistently present in the diet and always comprised considerably less of the population-level intake than pollock. As an aside, there is no evidence that the energetic content of fur seal diet was historically much higher than current estimates (Lucas, 1899; Kajimura, 1984; Zeppelin and Ream, 2006), indicating that energy-rich prey is not a prerequisite to achieve population growth in the Pribilof Islands. The most likely mechanism for increasing pup growth rates is therefore a reduction in foraging effort, which is unlikely to occur without increases in prey density (Costa, 2008; Neises et al., 2017). Increase in prey density would likely need to occur in relatively close proximity to the rookery to keep trip durations from becoming too long, as long trip durations adversely impact pup growth rates. High metabolic costs not only reduce the energy available for lactation, but also likely preclude females from accumulating fat reserves that can be used to compensate for periods of poor foraging success. Fur seals at Bogoslof Island accumulate fat reserves across the foraging season (Banks et al., 2006), and the ability to do so and maintain high daily energy intake (even when foraging effort is reduced) may be facilitated by the greater availability of energy-rich prey at this island (Zeppelin and Orr, 2010).
Conclusion
There has been a renewed interest in bioenergetic modeling efforts for marine mammals in recent years, but many of these efforts remain largely theoretical due to data limitations and the difficulty in integrating results into management decisions for predator and prey populations. Northern fur seals are a data-rich species, with the first observations on their biology collected over 130 years ago and a long-term research program that has collected demographic, diet, and behavioral data since the early part of the twentieth century. At the same time, the pollock fishery in the eastern Bering Sea is considered one of the best-managed fisheries in the world, and the existence of a multispecies stock assessment model provides a direct pathway to incorporate a protected marine mammal species into fishery management decisions. Given they were a significant source of mortality for both juvenile and mature pollock, explicitly incorporating fur seal predation into pollock stock assessment models is a critical next step. While the cause of the current population decline of northern fur seals is unknown, our results suggest that pup growth rates in the Pribilof Islands are unlikely to increase without concurrent changes in both prey distribution and abundance to facilitate reduced foraging effort and shorter trip durations. Our study is an important contribution to the management of a declining fur seal population and their commercially important prey species, and one that will aid in future modeling efforts to quantify fur seal-fisheries interactions and predict the impacts of climate change on fur seal population dynamics.
Data Availability Statement
The raw data supporting the conclusions of this article will be made available by the authors, without undue reservation.
Ethics Statement
Ethical review and approval was not required because there was no original research conducted on vertebrate animals for this study. This study was a modeling exercise that relied on research conducted and reported elsewhere.
Author Contributions
EM and JS designed the study. JS, TZ, and RR collected much of the data used to parameterize the model and estimate diet. EM, JS, KL, KH, and NP analyzed the data. EM led the writing of the manuscript with input from all authors.
Funding
Funding was provided by the Lenfest Ocean Program (# 00031538). NP was supported during this work by a National Research Council Postdoctoral Research Associateship at NOAA AFSC.
Conflict of Interest
The authors declare that the research was conducted in the absence of any commercial or financial relationships that could be construed as a potential conflict of interest.
Acknowledgments
We would like to acknowledge and thank the communities of St. Paul and St. George Islands, AK for their partnership, friendship, and assistance in conducting the field studies used in this manuscript. We thank grantees Mike Goebel, Dan Costa, and Alan Springer and financial support from the National Science Foundation (#9500072) and the North Pacific Research Board (#0414 and #0514) that supported field and laboratory studies in 1995/1996 and 2005/2006, respectively. These two studies further benefited from logistical and field support from Tom Loughlin, Rod Towell, Jason Baker, Bruce Robson, Sara Iverson, Jim Thomason, and Alison Banks. Study design and field efforts in 2004 and 2010 were led by Kate Call and Carey Kuhn and we thank them for their leadership in conducting and completing those studies. Mary Donahue was gracious in providing her original Ph.D. observations stored on 3.5-inch floppy disks for us to use in the study. Furthermore, we appreciate the help of William Walker in identifying prey species and discussions related to the diet analysis, and Devin Johnson for statistical advice. Field research was conducted under NMFS Marine Mammal Protection Act permit numbers 837, 782-1708-04, and 14327. The scientific results and conclusions, as well as any views or opinions expressed herein, are those of the author(s) and do not necessarily reflect those of NOAA or the Department of Commerce.
Supplementary Material
The Supplementary Material for this article can be found online at: https://www.frontiersin.org/articles/10.3389/fmars.2020.597973/full#supplementary-material
References
Antonelis, G. A., Sinclair, E. H., Ream, R. R., and Robson, B. W. (1997). Inter-island variation in the diet of female northern fur seals (Callorhinus ursinus) in the Bering Sea. J. Zool. 242, 435–451. doi: 10.1111/j.1469-7998.1997.tb03847.x
Arnould, J. P. Y. (1997). Lactation and the cost of pup-rearing in Antarctic fur seals. Mar. Mamm. Sci. 13, 516–526. doi: 10.1111/j.1748-7692.1997.tb00662.x
Banks, A., Iverson, S., Springer, A., Ream, R., and Sterling, J. (2006). Consequences of Fur Seal Foraging Strategies (COFFS). North Pacific Resarch Board Final Report 414. Anchorage, AK: North Pacific Research Board.
Becker, B. H., and Beissinger, S. R. (2006). Centennial decline in the trophic level of an endangered seabird after fisheries decline. Conserv. Biol. 20, 470–479. doi: 10.1111/j.1523-1739.2006.00379.x
Bejarano, A. C., Wells, R. S., and Costa, D. P. (2017). Development of a bioenergetic model for estimating energy requirements and prey biomass consumption of the bottlenose dolphin Tursiops truncatus. Ecol. Modell. 356, 162–172. doi: 10.1016/j.ecolmodel.2017.05.001
Bigg, M. A. (1986). Arrival of northern fur seals, Callorhinus ursinus, on St. Paul Island, Alaska. Fish. Bull. 84, 383–394.
Bowen, W. D., and Iverson, S. J. (2013). Methods of estimating marine mammal diets: a review of validation experiments and sources of bias and uncertainty. Mar. Mamm. Sci. 29, 719–754. doi: 10.1111/j.1748-7692.2012.00604.x
Boyd, A. I. L., and Duck, C. D. (1991). Mass changes and metabolism in territorial male Antarctic fur seals (Arctocephalus gazella). Physiol. Zool. 64, 375–392. doi: 10.1086/physzool.64.1.30158530
Calkins, D. G., Atkinson, S., Mellish, J. A., Waite, J. N., and Carpenter, J. R. (2013). The pollock paradox: juvenile Steller sea lions experience rapid growth on pollock diets in fall and spring. J. Exp. Mar. Bio. Ecol. 441, 55–61. doi: 10.1016/j.jembe.2013.01.011
Call, K. A., and Ream, R. R. (2012). Prey selection of subadult male northern fur seals (Callorhinus ursinus) and evidence of dietary niche overlap with adult females during the breeding season. Mar. Mamm. Sci. 28, 1–15. doi: 10.1111/j.1748-7692.2011.00463.x
Call, K. A., Ream, R. R., Johnson, D., Sterling, J. T., and Towell, R. G. (2008). Foraging route tactics and site fidelity of adult female northern fur seal (Callorhinus ursinus) around the Pribilof Islands. Deep Sea Res. II Top. Stud. Oceanogr. 55, 1883–1896. doi: 10.1016/j.dsr2.2008.04.022
Costa, D. P. (2008). A conceptual model of the variation in parental attendance in response to environmental fluctuation: foraging energetics of lactating sea lions and fur seals. Aquat. Conserv. Mar. Freshw. Ecosyst. 17, S44–S52. doi: 10.1002/aqc
Costa, D. P., Croxall, J. P., and Duck, C. D. (1989). Foraging energetics of Antarctic fur seals in relation to changes in prey availability. Ecology 70, 596–606. doi: 10.2307/1940211
Costa, D. P., and Gentry, R. L. (1986). “Reproductive energetics of northern fur seals,” in Fur seals: Maternal Strategies on Land and at Sea, eds R. L. Gentry and G. L. Kooyman (Princeton, NJ: Princeton University Press), 79–101. doi: 10.1515/9781400854691.79
Costa, D. P., and Trillmich, F. (1988). Mass changes and metabolism during the perinatal fast: a comparison between Antarctic (Arctocephalus gazella) and Galapagos fur seals (Arctocephalus galapagoensis). Physiol. Zool. 61, 160–169. doi: 10.1086/physzool.61.2.30156147
Dalton, A. J. M., Rosen, D. A. S., and Trites, A. W. (2015). Resting metabolic rate and activity: key components of seasonal variation in daily energy expenditure for the northern fur seal (Callorhinus ursinus). Can. J. Zool. 93, 635–644. doi: 10.1139/cjz-2014-0313
Dolan, T. E., Patrick, W. S., and Link, J. S. (2016). Delineating the continuum of marine ecosystem-based management: a US fisheries reference point perspective. ICES J. Mar. Sci. 73, 1042–1050. doi: 10.1093/icesjms/fsv242
Donohue, M. J., Costa, D. P., Goebel, E., Antonelis, G. A., and Baker, J. D. (2002). Milk intake and energy expenditure of free-ranging northern fur seal, Callorhinus ursinus, pups. Physiol. Biochem. Zool. 75, 3–18. doi: 10.1086/338284
Dwivedi, A. K., Mallawaarachchi, I., and Alvarado, L. A. (2017). Analysis of small sample size studies using nonparametric bootstrap test with pooled resampling method. Stat. Med. 36, 2187–2205. doi: 10.1002/sim.7263
Elliott, K. H., Woo, K. J., Gaston, A. J., Benvenuti, S., Dall’Antonia, L., and Davoren, G. K. (2009). Central-place foraging in an Arctic seabird provides evidence for Storer-Ashmole’s Halo. Auk 126, 613–625. doi: 10.1525/auk.2009.08245
Essington, T. E., Moriarty, P. E., Froehlich, H. E., Hodgson, E. E., Koehn, L. E., Oken, K. L., et al. (2015). Fishing amplifies forage fish population collapses. Proc. Natl. Acad. Sci. U.S.A. 112, 6648–6652. doi: 10.1073/pnas.1422020112
Fiscus, C. H., Baines, G. A., and Wilke, F. (1964). Pelagic fur Seal Investigations. Alaska. 1962. U.S. Fish Wildlife Service Special Scientific Report - Fisheries No. 475. Washington, DC: U.S. Fish and Wildlife Service.
Ford, J. K. B., Ellis, G. M., Olesiuk, P. F., and Balcomb, K. C. (2010). Linking killer whale survival and prey abundance: food limitation in the oceans’ apex predator? Biol. Lett. 6, 139–142. doi: 10.1098/rsbl.2009.0468
Gaichas, S., Aydin, K., and Francis, R. C. (2015). Wasp waist or beer belly? Modeling food web structure and energetic control in Alaskan marine ecosystems, with implications for fishing and environmental forcing. Prog. Oceanogr. 138, 1–17. doi: 10.1016/j.pocean.2015.09.010
Gentry, R. L. (1998). Behavior and Ecology of the Northern fur Seal. Princeton, NJ: Princeton University Press.
Georges, J. Y., and Guinet, C. (2000). Maternal care in the subantarctic fur seals on Amsterdam Island. Ecology 81, 295–308. doi: 10.1890/0012-9658(2000)081[0295:mcitsf]2.0.co;2
Gomez, M. D., Rosen, D. A. S., and Trites, A. W. (2016). Net energy gained by northern fur seals (Callorhinus ursinus) is impacted more by diet quality than by diet diversity. Can. J. Zool. 94, 123–135. doi: 10.1139/cjz-2015
Grémillet, D., Péron, C., Kato, A., Amélineau, F., Ropert-Coudert, Y., Ryan, P. G., et al. (2016). Starving seabirds: unprofitable foraging and its fitness consequences in Cape gannets competing with fisheries in the Benguela upwelling ecosystem. Mar. Biol. 163:35. doi: 10.1007/s00227-015-2798-2
Gudmundson, C. J., Zeppelin, T. K., and Ream, R. R. (2000). Application of two methods for determining diet of northern fur seals (Callorhinus ursinus). Fish. Bull. 104, 445–455.
Haynie, A. C., and Pfeiffer, L. (2013). Climatic and economic drivers of the Bering Sea walleye pollock (Theragra chalcogramma) fishery: implications for the future. Can. J. Fish. Aquat. Sci. 70, 841–853. doi: 10.1139/cjfas-2012-0265
Holsman, K. K., Ianelli, J., Aydin, K., Punt, A. E., and Moffitt, E. A. (2016). A comparison of fisheries biological reference points estimated from temperature-specific multi-species and single-species climate-enhanced stock assessment models. Deep Sea Res. II Top. Stud. Oceanogr. 134, 360–378. doi: 10.1016/j.dsr2.2015.08.001
Holsman, K. K., Ianelli, J. N., Aydin, K., and Spies, I. (2019). 2019 Climate-Enhanced Multi-Species Stock Assessment for Walleye Pollock, Pacific Cod, and Arrowtooth Flounder in the Eastern Bering Sea. In Stock Assessment and Fishery Evaluation Report for the Groundfish Resources of the Bering Sea/Aleutian I. Seattle, WA: NOAA.
Ianelli, J., Holsman, K. K., Punt, A. E., and Aydin, K. (2016). Multi-model inference for incorporating trophic and climate uncertainty into stock assessments. Deep Sea Res. II Top. Stud. Oceanogr. 134, 379–389. doi: 10.1016/j.dsr2.2015.04.002
Ianelli, J. N., Barbeaux, S., Honkalehto, T., Kotwicki, S., Aydin, K., and Williamson, N. (2019). Chapter 1: Assessment of the Walleye Pollock Stock in the Eastern Bering Sea. In Stock Assessment and Fishery Evaluation Report for the Groundfish Resources of the Bering Sea/Aleutian Islands Regions. Available online at: https://archive.fisheries.noaa.gov/afsc/REFM/docs/2019/EBSpollock.pdf (accessed July 18, 2020).
Iooss, B., Janon, A., Pujol, G., Broto, B., Boumhaout, K., Da Veiga, S., et al. (2020). Sensitivity: Global Sensitivity Analysis of Model Outputs. R package version 1.18.0. Available online at: https://CRAN.R-project.org/package=sensitivity
Jeanniard du Dot, T., Trites, A. W., Arnould, J. P. Y., Speakman, J. R., and Guinet, C. (2018). Trade-offs between foraging efficiency and pup feeding rate of lactating northern fur seals in a declining population. Mar. Ecol. Prog. Ser. 600, 207–222. doi: 10.3354/meps12638
Joy, R., Tollit, D. J., Laake, J. L., and Trites, A. W. (2006). “Using simulations to evaluate reconstructions of sea lion diet from scat,” in Sea Lions of the World, eds A. W. Trites, S. K. Atkinson, D. P. DeMaster, L. W. Fritz, T. Gelatt, L. D. Rea, et al. (Anchorage, AK: University of Alaska Press), 205–221. doi: 10.1016/j.tmaid.2017.06.004
Kajimura, H. (1984). Opportunistic Feeding of the Northern Fur Seal, Callorhinus ursinus, in the eastern North Pacific Ocean and eastern Bering Sea. U.S. Dep. Commer., NOAA Tech. Rep. NMFS SSRF- 779. Washington, DC: United States Department of Commerce.
Kenyon, K. W., and Wilke, F. (1953). Migration of the northern fur seal, Callorhinus ursinus. J. Mammal. 34, 86–98. doi: 10.2307/1375947
Kiyota, M., Kawai, C., and Baba, N. (1999). Estimation of diet of male northern fur seals (Callorhinus ursinus) based on analysis of fecal and regurgitated materials. Bull. Natl. Res. Inst. Far Seas Fish. 36, 1–7. doi: 10.1111/j.1748-7692.2011.00463.x
Kokubun, N., Takahashi, A., Ito, M., Matsumoto, K., Kitaysky, A. S., and Watanuki, Y. (2010). Annual variation in the foraging behaviour of thick-billed murres in relation to upper-ocean thermal structure around St. George Island, Bering Sea. Aquat. Biol. 8, 289–298. doi: 10.3354/ab00243
Kozloff, P. (1986). Fur Seal Investigations, 1984, U.S. Dep. Commer., NOAA Tech. Memo. NMFS F/NWC- 97, 86. Washington, DC: United States Department of Commerce.
Kuhn, C. E., Baker, J. D., Towell, R. G., and Ream, R. R. (2014a). Evidence of localized resource depletion following a natural colonization event by a large marine predator. J. Anim. Ecol. 83, 1169–1177. doi: 10.1111/1365-2656.12202
Kuhn, C. E., Ream, R. R., Sterling, J. T. T., Thomason, J. R., and Towell, R. G. (2014b). Spatial segregation and the influence of habitat on the foraging behavior of northern fur seals (Callorhinus ursinus). Can. J. Zool. 92, 861–873. doi: 10.1139/cjz-2014-0087
Ladds, M. A., Slip, D. J., and Harcourt, R. G. (2017a). Intrinsic and extrinsic influences on standard metabolic rates of three species of Australian otariid. Conserv. Physiol. 5:cow074. doi: 10.1093/conphys/cow074
Ladds, M. A., Slip, D. J., and Harcourt, R. G. (2017b). Swimming metabolic rates vary by sex and development stage, but not by species, in three species of Australian otariid seals. J. Comp. Physiol. B 187, 503–516. doi: 10.1007/s00360-016-1046-5
Lang, G., Derrah, C. W., and Livingston, P. A. (2003). Groundfish Food Habits and Predation on Commercially Important Prey Species in the Eastern Bering Sea from 1993 Through 1996. U.S. Dep. Commer., NOAA AFSC Processed Rep. 2003–04, 351. Washington, DC: United States Department of Commerce.
Lea, M.-A., Johnson, D., Ream, R., Sterling, J., Melin, S., and Gelatt, T. (2009). Extreme weather events influence dispersal of naive northern fur seals. Biol. Lett. 5, 252–257. doi: 10.1098/rsbl.2008.0643
Lindegren, M., Van Deurs, M., MacKenzie, B. R., Worsoe Clausen, L., Christensen, A., and Rindorf, A. (2018). Productivity and recovery of forage fish under climate change and fishing: North Sea sandeel as a case study. Fish. Oceanogr. 27, 212–221. doi: 10.1111/fog.12246
Livingston, P. A., Aydin, K., Boldt, J. L., Hollowed, A. B., and Napp, J. M. (2011). “Alaska marine fisheries management: advances and linkages to ecosystem research,” in Ecosystem-Based Management for Marine Fisheries: An Evolving Perspective, eds A. Belgrano and C. W. Fowler (Cambridge: Cambridge University Press), 113–152. doi: 10.1017/cbo9780511973956.006
Livingston, P. A., Aydin, K., Buckley, T. W., Lang, G. M., Yang, M. S., and Miller, B. S. (2017). Quantifying food web interactions in the North Pacific – a data-based approach. Environ. Biol. Fishes 100, 443–470. doi: 10.1007/s10641-017-0587-0
Lucas, F. A. (1899). “The food of the northern fur seals,” in The Fur Seal and Fur Seal Islands of the North Pacific Ocean, Part 3, ed. D. S. Jordan (Washington, DC: Government Printing Office), 59–68.
Lunn, N. J., Boyd, I. L., Barton, T., and Croxall, J. P. (1993). Factors affecting the growth rate and mass at weaning of Antarctic fur seals at Bird Island, South Georgia. J. Mammal. 74, 908–919. doi: 10.2307/1382429
McAlister, W. B., and Perez, M. A. (1977). “Ecosystem Dynamics–Birds and Marine Mammals, Part I: Preliminary Estimates of Pinniped-Finfish Relationships in the Bering Sea (final report); in Environmental Assessment of the Alaskan Continental Shelf, Annual Report, Vol. 12, (Washington, DC: United States Department of Commerce), 342–371.
McHuron, E., Mangel, M., Schwarz, L. K., and Costa, D. P. (2017). Energy and prey requirements of California sea lions under variable environmental conditions. Mar. Ecol. Prog. Ser. 567, 235–247. doi: 10.3354/meps12041
McHuron, E. A., Sterling, J. T., Costa, D. P., and Goebel, M. E. (2019). Factors affecting energy expenditure in a declining fur seal population. Conserv. Physiol. 7:coz103. doi: 10.1093/conphys/coz103
Miller, L. K. (1978). Energetics of the Northern fur Seal in Relation to Climate and Food Resources of the Bering Sea. Marine Mammal Commission Report 75/8. Bethesda, MD: Marine Mammal Commission.
Mueter, F. J., Bond, N. A., Ianelli, J. N., and Hollowed, A. B. (2011). Expected declines in recruitment of walleye pollock (Theragra chalcogramma) in the eastern Bering Sea under future climate change. ICES J. Mar. Sci. 68, 1284–1296. doi: 10.1093/icesjms/fsr022
Muto, M. M., Helker, V. T., Delean, B. J., Angliss, R. P., Boveng, P. L., Breiwick, J. M., et al. (2020). Alaska Marine Mammal Stock Assessments, 2019. U.S. Dep. Commer., NOAA Tech. Memo. NMFS-AFSC- 404. Washington, DC: United States Department of Commerce.
Neises, V., Zeligs, J., Harris, B., and Cornick, L. (2017). Examining the metabolic cost of otariid foraging under varying conditions. J. Exp. Mar. Biol. Ecol. 486, 352–357. doi: 10.1016/j.jembe.2016.11.001
Nielsen, J. M., Kratina, P., Clare, E. L., Hayden, B., and Brett, M. T. (2018). Diet tracing in ecology: method comparison and selection. Methods Ecol. Evol. 9, 278–291. doi: 10.1111/2041-210X.12869
Ogutu, J. O., and Owen-Smith, N. (2003). ENSO, rainfall and temperature influences on extreme population declines among African savanna ungulates. Ecol. Lett. 6, 412–419. doi: 10.1046/j.1461-0248.2003.00447.x
Oro, D., Cam, E., Pradel, R., and Martínez-Abraín, A. (2004). Influence of food availability on demography and local population dynamics in a long-lived seabird. Proc. Biol. Sci. 271, 387–396. doi: 10.1098/rspb.2003.2609
Perez, M. A., and McAlister, W. B. (1993). Estimates of Food Consumption by Marine Mammals in the eastern Bering Sea. U.S. Dep. Commer., NOAA Tech. Memo. NMFS-AFSC-14. Washington, DC: United States Department of Commerce
Perez, M. A., and Mooney, E. E. (1986). Increased food and energy consumption of lactating northern fur seals Callorhinus ursinus. Fish. Bull. 84, 371–381.
Peterson, R. S. (1965). Behavior of the Northern fur Seal. Ph.D. thesis, John Hopkins University, Baltimore, MD.
Phillips, E. M., and Harvey, J. T. (2009). A captive feeding study with the Pacific harbor seal (Phoca vitulina richardii): Implications for scat analysis. Mar. Mamm. Sci. 25, 373–391. doi: 10.1111/j.1748-7692.2008.00265.x
R Core Team. (2020). R: A language and environment for statistical computing. R Foundation for Statistical Computing, Vienna. Available online at: https://www.R-project.org/
Ream, R. R., Sterling, J. T., and Loughlin, T. R. (2005). Oceanographic features related to northern fur seal migratory movements. Deep Sea Res. II Top. Stud. Oceanogr. 52, 823–843. doi: 10.1016/j.dsr2.2004.12.021
Renner, H. M., Mueter, F., Drummond, B. A., Warzybok, J. A., and Sinclair, E. H. (2012). Patterns of change in diets of two piscivorous seabird species during 35 years in the Pribilof Islands. Deep Sea Res. II Top. Stud. Oceanogr. 65–70, 273–291. doi: 10.1016/j.dsr2.2012.02.014
Ronget, V., Gaillard, J.-M., Coulson, T., Garratt, M., Gueyffier, F., Lega, J.-C., et al. (2018). Causes and consequences of variation in offspring body mass: meta-analyses in birds and mammals. Biol. Rev. Camb. Philos. Soc. 93, 1–27. doi: 10.1111/brv.12329
Rosen, D. A., Young, B. L., and Trites, A. W. (2012). Rates of maximum food intake in young northern fur seals (Callorhinus ursinus) and the seasonal effects of food intake on body growth. Can. J. Zool. 90, 61–69. doi: 10.1139/Z11-112
Roth, J. D. (2002). Temporal variability in arctic fox diet as reflected in stable-carbon isotopes; the importance of sea ice. Oecologia 133, 70–77. doi: 10.1007/s00442-002-1004-7
Sanger, G. A. (1974). A Preliminary Look at Marine Mammal-Food Chain Relationships in Alaskan Waters. (Seattle, WA: NOAA), 29.
Schmidt-Nielsen, K. (1997). Animal Physiology: Adaptation and Environment, 5th Edn. Cambridge: Cambridge University Press.
Schulz, T. M., and Bowen, W. D. (2004). Pinniped lactation strategies: evaluation of data on maternal and offspring life history traits. Mar. Mamm. Sci. 20, 86–114. doi: 10.1111/j.1748-7692.2004.tb01142.x
Sillett, T. S., Holmes, R. T., and Sherry, T. W. (2000). Impacts of a global climate cycle on population dynamics of a migratory songbird. Science 288, 2040–2042. doi: 10.1126/science.288.5473.2040
Sinclair, E. H., Antonelis, G. A., Robson, B. W., and Ream, R. R. (1993). Northern fur Seal Predation on Juvenile Walleye Pollock. Work. Seattle, WA: National Marine Mammal Laboratory.
Spencer, P. D., Holsman, K. K., Zador, S., Bond, N. A., Mueter, F. J., Hollowed, A. B., et al. (2016). Modelling spatially dependent predation mortality of eastern Bering sea walleye pollock, and its implications for stock dynamics under future climate scenarios. ICES J. Mar. Sci. 73, 1330–1342. doi: 10.1093/icesjms/fsw040
Stabeno, P. J., and Bell, S. W. (2019). Extreme conditions in the Bering Sea (2017–2018): record-breaking low sea-ice extent. Geophys. Res. Lett. 46, 8952–8956. doi: 10.1029/2019GL083816
Sterling, J. T., and Ream, R. R. (2004). At-sea behavior of juvenile male northern fur seals (Callorhinus ursinus). Can. J. Zool. 82, 1621–1637. doi: 10.1139/Z04-136
Stevenson, D. E., and Lauth, R. R. (2019). Bottom trawl surveys in the northern Bering Sea indicate recent shifts in the distribution of marine species. Polar Biol. 42, 407–421. doi: 10.1007/s00300-018-2431-1
Swartzman, G., and Haar, R. (1980). Exploring Interactions Between fur Seal Populations and Fisheries in the Bering Sea. Final report to U.S. Marine Mammal Commission. MMC-80/01. Bethesda, MD: Marine Mammal Commission.
Sweeney, J. M., and Harvey, J. T. (2011). Diet estimation in California sea lions, Zalophus californianus. Mar. Mamm. Sci. 27, 279–301. doi: 10.1111/j.1748-7692.2010.00459.x
Tollit, D., Fritz, L., Joy, R., Miller, K., Schulze, A., Thomason, J., et al. (2017). Diet of endangered steller sea lions (Eumetopias jubatus) in the Aleutian islands: new insights from DNA detections and bioenergetic reconstructions. Can. J. Zool. 95, 853–868. doi: 10.1139/cjz-2016-0253
Tollit, D. J., Heaslip, S. G., Barrick, R. L., and Trites, A. W. (2007). Impact of diet-index selection and the digestion of prey hard remains on determining the diet of the Steller sea lion (Eumetopias jubatus). Can. J. Zool. 85, 1–15. doi: 10.1139/z06-174
Tollit, D. J., Heaslip, S. G., Zeppelin, T. K., Joy, R., Call, K. A., and Trites, A. W. (2004). A method to improve size estimates of walleye pollock (Theragra chalcogramma) and Atka mackerel (Pleurogrammus monopterygius) consumed by pinnipeds: digestion correction factors applied to bones and otoliths recovered in scats. Fish. Bull. 102, 498–508.
Tollit, D. J., Wong, M., Winship, A. J., Rosen, D. A., and Trites, A. W. (2003). Quantifying errors associated with using prey skeletal structures from fecal samples to determine the diet of Steller’s sea lion (Eumetopias jubatus). Mar. Mamm. Sci. 19, 724–744. doi: 10.1111/j.1748-7692.2003.tb01127.x
Tollit, D. J., Wong, M. A., and Trites, A. W. (2015). Diet composition of Steller sea lions (Eumetopias jubatus) in Frederick Sound, southeast Alaska: A comparison of quantification methods using scats to describe temporal and spatial variabilities. Can. J. Zool. 93, 361–376. doi: 10.1139/cjz-2014-0292
Towell, R. G., Ream, R. R., and York, A. E. (2006). Decline in northern fur seal (Callorhinus ursinus) pup production on the Pribilof Islands. Mar. Mamm. Sci. 22, 486–491. doi: 10.1111/j.1748-7692.2006.00026.x
Trites, A. W., and Joy, R. (2005). Dietary analysis from fecal samples: how many scats are enough? J. Mammal. 86, 704–712. doi: 10.1644/1545-1542(2005)086[0704:daffsh]2.0.co;2
Trivelpiece, W. Z., Hinke, J. T., Miller, A. K., Reiss, C. S., Trivelpiece, S. G., and Watters, G. M. (2011). Variability in krill biomass links harvesting and climate warming to penguin population changes in Antarctica. Proc. Natl. Acad. Sci. U.S.A. 108, 7625–7628. doi: 10.1073/pnas.1016560108
Valeix, M., Hemson, G., Loveridge, A. J., Mills, G., and Macdonald, D. W. (2012). Behavioural adjustments of a large carnivore to access secondary prey in a human-dominated landscape. J. Appl. Ecol. 49, 73–81. doi: 10.1111/j.1365-2664.2011.02099.x
Waite, J. N., Burkanov, V. N., and Andrews, R. D. (2012). Prey competition between sympatric Steller sea lions (Eumetopias jubatus) and northern fur seals (Callorhinus ursinus) on Lovushki Island, Russia. Can. J. Zool. 90, 110–127. doi: 10.1139/z11-117
Winship, A., Trites, A., and Rosen, D. (2002). A bioenergetic model for estimating the food requirements of Steller sea lions Eumetopias jubatus in Alaska, USA. Mar. Ecol. Prog. Ser. 229, 291–312. doi: 10.3354/meps229291
Winship, A. J., Hunter, A. M. J., Rosen, D. A. S., and Trites, A. W. (2006). “Food consumption by sea lions: existing data and techniques,” in Sea Lions of the World, eds A. W. Trites, S. K. Atkinson, D. P. DeMaster, L. W. Fritz, T. Gelatt, L. D. Rea, et al. (Anchorage, AK: University of Alaska Press), 177–191. doi: 10.4027/slw.2006.13
York, A. E., and Hartley, J. R. (1981). Pup production following harvest of female northern fur seals. Can. J. Fish. Aquat. Sci. 38, 84–90. doi: 10.1139/f81-011
York, A. E., and Scheffer, V. B. (1997). Timing of implantation in the northern fur seal, Callorhinus ursinus. J. Mammal. 78, 675–683. doi: 10.2307/1382919
Zeppelin, T., Pelland, N., Sterling, J., Brost, B., Melin, S., Johnson, D., et al. (2019). Migratory strategies of juvenile northern fur seals (Callorhinus ursinus): bridging the gap between pups and adults. Sci. Rep 9:13921.
Zeppelin, T. K., and Orr, A. J. (2010). Stable isotope and scat analyses indicate diet and habitat partitioning in northern fur seals Callorhinus ursinus across the eastern Pacific. Mar. Ecol. Prog. Ser. 409, 241–253. doi: 10.3354/meps08624
Zeppelin, T. K., and Ream, R. R. (2006). Foraging habitats based on the diet of female northern fur seals (Callorhinus ursinus) on the Pribilof Islands, Alaska. J. Zool. 270, 565–576. doi: 10.1111/j.1469-7998.2006.00122.x
Zeppelin, T. K., Tollit, D. J., Call, K. A., Orchard, T. J., and Gudmundson, C. J. (2004). Sizes of walleye pollock (Theragra chalcogramma) and Atka mackerel (Pleurogrammus monopterygius) consumed by the western stock of Steller sea lions (Eumetopias jubatus) in Alaska from 1998 to 2000. Fish. Bull. 102, 509–521.
Keywords: northern fur seals, Callorhinus ursinus, Bering Sea, walleye pollock, ecosystem-based fisheries management, Pribilof Islands
Citation: McHuron EA, Luxa K, Pelland NA, Holsman K, Ream R, Zeppelin T and Sterling JT (2020) Practical Application of a Bioenergetic Model to Inform Management of a Declining Fur Seal Population and Their Commercially Important Prey. Front. Mar. Sci. 7:597973. doi: 10.3389/fmars.2020.597973
Received: 23 August 2020; Accepted: 04 November 2020;
Published: 03 December 2020.
Edited by:
Alastair Martin Mitri Baylis, South Atlantic Environmental Research Institute, Falkland IslandsReviewed by:
Russel D. Andrews, University of Alaska Fairbanks, United StatesTiphaine Jeanniard Du Dot, UMR 7372 Centre d’études biologiques de Chizé (CEBC), France
Copyright © 2020 McHuron, Luxa, Pelland, Holsman, Ream, Zeppelin and Sterling. This is an open-access article distributed under the terms of the Creative Commons Attribution License (CC BY). The use, distribution or reproduction in other forums is permitted, provided the original author(s) and the copyright owner(s) are credited and that the original publication in this journal is cited, in accordance with accepted academic practice. No use, distribution or reproduction is permitted which does not comply with these terms.
*Correspondence: Elizabeth A. McHuron, emchuron@uw.edu