Arthropod co-occurrence networks indicate environmental differences between islands and signal introduced species in Azorean native forest remnants
 Gabor Pozsgai1*
  Pedro Cardoso1,2
  François Rigal1,3
  Mário Boieiro1
  Rosalina Gabriel1 Eduardo Brito de Azevedo4
  Paulo A. V. Borges1
- 1Ce3C–Centre for Ecology, Evolution and Environmental Changes, Azorean Biodiversity Group, Faculty of Agricultural Sciences and Environment, CHANGE–Global Change and Sustainability Institute, University of the Azores, Angra do Heroísmo, Portugal
- 2LIBRe–Laboratory for Integrative Biodiversity Research, Finnish Museum of Natural History, University of Helsinki, Helsinki, Finland
- 3Institut Des Sciences Analytiques et de Physico Chimie Pour L'environnement et les Materiaux, CNRS–Université de Pau et des Pays de l’Adour – E2S UPPA, Pau, France
- 4Group of Climate, Meteorology and Global Change, Faculty of Agriculture and Environment, Institute of Research and Technologies for Agriculture and Environment (IITAA), University of the Azores, Angra do Heroísmo, Portugal
Island biotas are in imminent threat from anthropogenic impacts. Of these impacts, the negative effects of exotic species on the taxonomic and functional diversity of the local fauna are of major concern. Exotics may also have a detrimental effect on interspecific interactions which, in turn, can destabilize ecological networks. Species co-occurrence networks can detect species-to-species associations and are used to predict ecological interaction networks and utilized as tools to assess environmental impacts on community structure. Here, we aim to investigate whether or not topological differences of the arthropod co-occurrence networks among native forest fragments from seven Azorean islands can reveal the influence of the abiotic environment and exotic species on these networks. Co-occurrence networks were sensitive to environmental and community dissimilarities, showing a clear separation between islands and pinpointed differences between indigenous and exotic networks. Most exotics were little connected and exotic networks had a large proportion of unconnected species. The resulting decreased connectance and the increased modularity with the increase of the proportions of exotics in the networks suggest that most exotics have too low prevalence to show associations with other species, and only a few dominants drive co-occurrences. The proportion of negative links, as indicators of competition, did not increase with the increase of exotics in the habitats, suggesting that exotics provided new functional roles when they colonized native forest remnants. However, when the theoretical networks consisting of only indigenous species were investigated, connectance decreased and closeness increased with the increase of exotics, suggesting processes of network degradation. Since our study provides ample evidence for the usefulness of co-occurrence network analysis in studying island ecosystems, we recommend the use of this tool for ecosystem assessments, early warning systems and decision-making in island biodiversity conservation.
1. Introduction
Due to their isolated nature and fragile ecosystems, with a high number of endemic species, islands are particularly threatened by anthropogenic stressors and thus their endemic and native non-endemic (hereafter native) species are declining at an unprecedented pace (Gillespie and Roderick, 2002; Fernández-Palacios et al., 2021). While worldwide species declines can stem from a broad range of causes, the majority of threats to native flora and fauna on islands originates from two major sources: loss and fragmentation of natural habitats due to changes in land use and the introduction of exotics, some of which becoming important invasive species (Cardoso et al., 2010; Triantis et al., 2010; Borges et al., 2019; Pyšek et al., 2020; Fernández-Palacios et al., 2021). Biodiversity decline and homogenization unfold in degrading interaction networks (Laliberté and Tylianakis, 2010; Burkle et al., 2013), which, in turn, decreases the stability and resilience of ecosystems and results in loss of biodiversity function (Valiente-Banuet et al., 2015). Since biotic interactions underpin ecological functions, most of which are crucial in delivering the ecosystem services humans vitally depend on (e.g., Albrecht et al., 2014; Hines et al., 2015), the importance of the protection of healthy ecological networks has been increasingly recognized (Tylianakis et al., 2010; Heleno et al., 2020). Interactions between species tend to break up on environmental stress sooner than species get extinct or communities change substantially (Valiente-Banuet et al., 2015), thus conventional species richness or diversity-based studies may be less effective in detecting changes than those scrutinizing interspecific relationships. Since changes in interaction networks could also serve as early warning signal for conservation management, there is an urgent need to understand how these networks are impacted by anthropogenic stresses. Yet, whereas the direct loss of species is relatively easy to quantify, the impact of exotics precipitating into ecological networks is more difficult to study as it requires data on species interactions (Sax et al., 2002; Borges et al., 2020).
Since interaction networks are notoriously difficult to map, predicting ‘putative interactions’ based on species’ non-random associations is proposed as a proxy to real-life networks (e.g., Bohan et al., 2011, 2017). Although association between species pairs in co-occurrence networks do not necessarily reflect biotic interactions (Freilich et al., 2018; Blanchet et al., 2020), these networks nevertheless proved to be sensitive to environmental variations (Araújo et al., 2011; Lima-Mendez et al., 2015; Pozsgai et al., 2016) and to reflect anthropogenic impacts (Veech, 2006; Kay et al., 2018; Elo et al., 2021; Yuan et al., 2021). Recent advances, such as accounting for co-occurrences due to similar environmental requirements and phylogenetic similarity, further increased the suitability of these association networks to serve as surrogates for real-life interaction networks (Ovaskainen et al., 2016; Tikhonov et al., 2017; Kurtz et al., 2019). Thus, while they should be interpreted with caution, these advanced co-occurrence networks can be used as informed predictions to interactions. This is particularly true when co-occurrences are based on small-scale sampling, the macro-environment is highly similar, and in which physical sample size do not exceed the normal mobility range of the focal species and thus spatially associated species are more likely to interact (Araújo and Rozenfeld, 2014; Goberna and Verdú, 2022). Thus, investigating relatively well-documented island faunas through co-occurrence networks offers a feasible way to study how environmental factors shape local community assemblage structure (Griffith et al., 2016) and to predict the impact these factors can have on interaction networks.
Analyzing the structure (topology) of these co-occurrence networks can both facilitate the early detection of degrading effects and pinpoint the most vulnerable species and the most threatening exotics which, in turn, has the potential to inform stakeholders and decision-makers to maximize the success of conservation management (Delmas et al., 2019).
The Azores archipelago has been under intensive anthropogenic influence for nearly 600 years, with most of its native habitat areas being converted to agricultural landscapes (Triantis et al., 2010) and a high number of exotic species introduced (Borges et al., 2010). Taxonomic, functional and phylogenetic diversity patterns and community structures of Azorean arthropods have been widely studied (Borges et al., 2005, 2016; Rigal et al., 2018), but little attention focused on ecological networks of interspecific associations (Rego et al., 2019; Valido and Olesen, 2022). Exotics in the Azores spread rapidly (Borges et al., 2020) and the role they play in ecological networks, and how their proportion in the local fauna influences network structure is yet to be determined.
The availability of this unique dataset on the arthropods of the Azores provides an opportunity to map detailed co-occurrence networks, compare them among islands, and relate them to biotic and abiotic environmental factors.
In this study we aimed to investigate if and how arthropod association networks in the Azores depend on abiotic and biotic factors with a particular focus on the impact of exotic species.
In regard to the abiotic factors, we hypothesize that although species pools among the Azorean islands are highly similar, due to the presence of single island endemics and the differences in the non-native species pool, the topologies of co-occurrence networks differ between islands (H1). We predict that island association network structure will depend on the size of habitat remnants and the size proportion of these remnants in the landscape, as well as on the size of the island (P1). Moreover, island association network topologies are also likely to be driven by abiotic factors, such as temperature, precipitation, or altitudinal range (P2).
As for the biotic factors influencing association networks, we hypothesized that associations between exotics and natives are non-random (H2) and that the presence of exotic species influence the structure of co-occurrence networks (H3). We predict that native and exotic species will not have the same role in the network, thus their node properties will differ (P3).
Biotic stress (e.g., increased competition) can cause species to become rare, which results in these species sharing fewer sites with others and thus having fewer co-occurrence links. Ultimately, these species will not reach the detection threshold in samples and will be exempted from the networks (Kay et al., 2018). This leads to a significant decline in the number of nodes but not so much in the number of edges because of the low number of links to other species of the exempted species. Furthermore, the introduction of exotics increases the number of species (nodes) but, since they are most commonly habitat generalists, they are likely to co-occur with many other species frequently and large enough numbers to form interspecific associations, which thus increases the number of edges at a greater pace than that of nodes (Fridley et al., 2007). Since both processes increase the realized associations to all potential associations ratio (connectance), we predicted that the connectance will increase, and the modularity decline, with the increasing number of exotics (P4). We also anticipate that, if competitive exclusion was a major factor driving associations, the proportion of negative edges among all edges will increase with the increasing number of exotics (P5).
2. Materials and methods
Arthropod sampling followed the ‘Biodiversity of Arthropods from the Laurisilva of the Azores’ (BALA) protocol (Borges et al., 2005, 2006, 2016; Gaspar et al., 2008). Arthropods were collected in native forest remnants on seven islands of the Azores archipelago (Faial, Flores, Pico, Santa Maria, São Jorge, São Miguel, Terceira, Figure 1) from 1999 to 2002 (BALA I) (Borges et al., 2005) and in 2010 and 2011 (BALA II) (Borges et al., 2016). Altogether, 91 unique transects were sampled, at 116 sampling occasions, 81 in BALA I and 35 in BALA II, always in summer, between May and September. Twenty-three sites from BALA I were repeatedly sampled in BALA II. In order to maximize the coverage of sampled diversity, two complementary methods were applied: pitfall trapping was used to sample ground-dwelling arthropods and tree and shrub beating was used to collect canopy-dwelling arthropods. In each forest patch, 30 pitfall traps were placed along a 150-meter-long transect. Of the 30 traps, 15 were filled with a general attractive solution (Turquin, 1973), a mixture of dark beer, chloral hydrate, formalin and glacial acetic acid, and the other 15 with ethylene-glycol. In each transect, ten beating samples were taken from the three most common native woody plant species. The most common trees and shrubs sampled were Juniperus brevifolia (Cupressaceae), Erica azorica (Ericaceae), Ilex azorica (Aquifoliaceae), Laurus azorica (Lauraceae) and Vaccinium cylindraceum (Ericaceae) (Ribeiro et al., 2005; Gaspar et al., 2008).
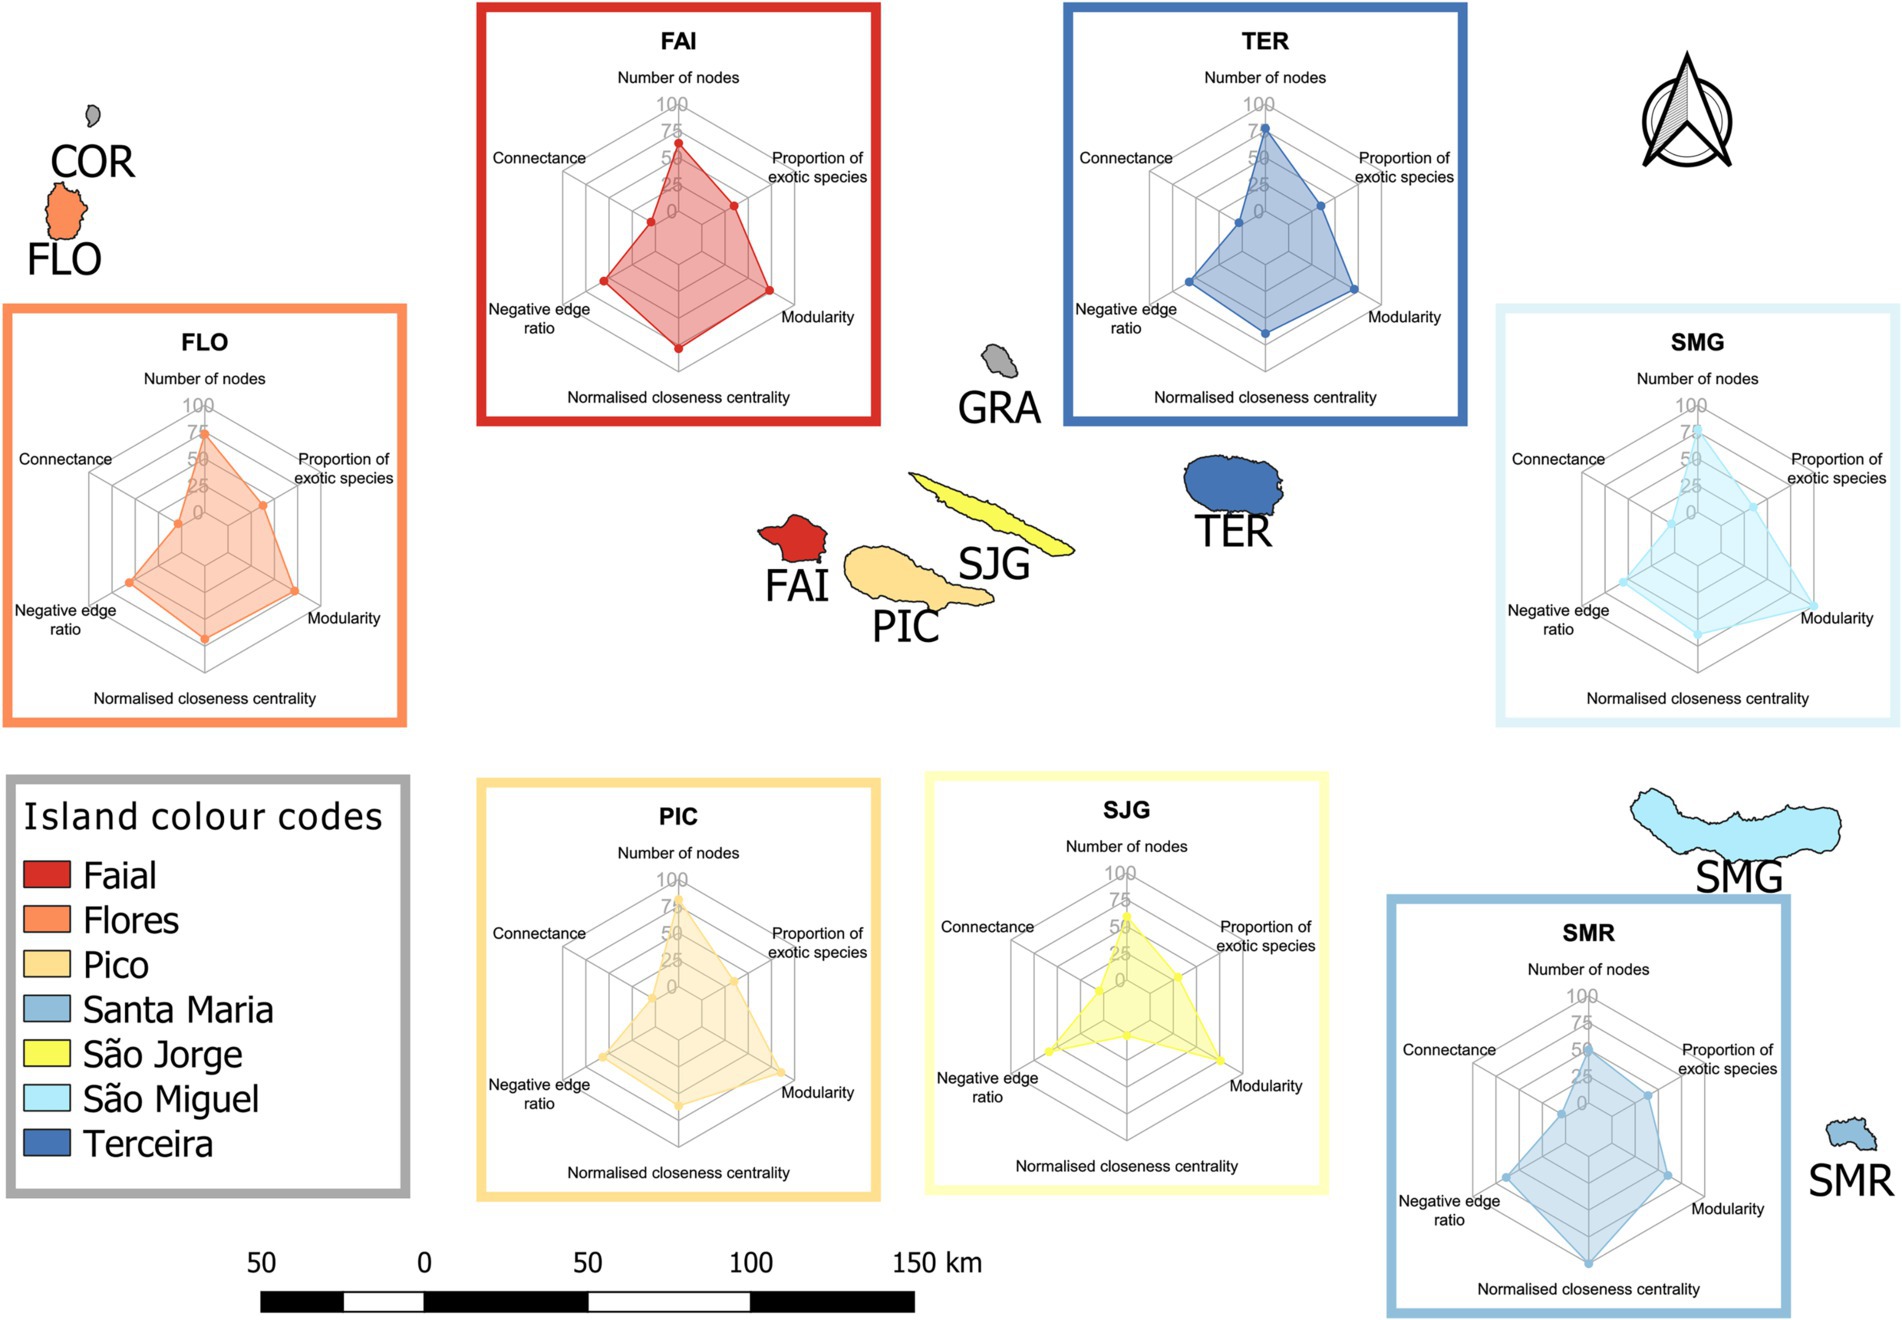
Figure 1. Map of the Azorean archipelago and the basic characteristics of the island co-occurrence networks. Islands are color coded and squares with borders of corresponding colors contain radar charts showing (clockwise from the top) (1) the percentage of island species richness to the species richness in the meta-network, (2) the percentage of exotic species to the island species richness, (3) the island modularity as a percentage of the maximum modularity of all islands, (4) the normalized closeness centrality of the island as a percentage of the maximum normalized closeness centrality of all islands, (5) the percentage of negative edges of all edges in an island, (6) connectance of a network. Island abbreviations: FAI – Faial, FLO – Flores, PIC – Pico, SJG – São Jorge, SMG – São Miguel, SMR – Santa Maria, TER – Terceira.
2.1. Climatic variables
The environmental variables were obtained from the CIELO model (Azevedo et al., 1999). This is a physical model based on the transformations experienced by an air mass crossing over a mountain, and simulates the evolution of an air parcel’s physical properties starting from the sea level up to the mountain. The model has been developed in order to produce high-resolution fields of the elemental climatic variables (pressure, temperature, rainfall, relative humidity, etc.) using a grid resolution of 100 by 100 m cell size (for more detail see also Borges et al., 2006). Significantly highly correlating environmental variables (Spearman’s p < 0.05, Spearman’s Rho >|0.6|) were removed prior to the analysis.
2.2. Network generation and analysis
A meta-network of species associations, including all BALA data, was generated using the co-occurrence analysis method by Kurtz et al. (2019). This method uses latent graphical model inference to decompose the raw species to species association matrix, based on Pearson correlations, derived from abundance data, into a sparse set of associations based on partial correlations, and latent associations driven by environmental covariates. This method disentangles direct associations from those that are the results of commonly affecting latent environmental determinants, and thus it has the potential to reduce the number of false positives and allows a more precise prediction of real-life interactions based on abundance data.
Since BALA I and BALA II are separated in time, two separate co-occurrence networks, one for the years of BALA I and one for those of BALA II, were generated using the slr method implemented in the SpiecEasi package (Kurtz et al., 2015) using two separate species-site abundance matrices as baseline datasets. The lambda minimum ratio parameter of the spiec. easi() function was set to 0.01 and the process ran in 50 iterations.
In these datasets, adults and juveniles of the same species were recorded separately into morphospecies-trait `pseudospecies` when the ecological functions of adult and juvenile stages were substantially different (e.g., Lepidoptera). Co-occurrences of very rare species cannot be calculated, and thus they do not give extra information to the analysis, but their inclusion in datasets extends computing time. Therefore, species with less than ten individuals in overall abundance and those occurring at less than three sampling sites were removed and excluded from the further analysis. Based on Borges et al. (2016), each species in the networks was categorized as either endemic to the Azores, non-endemic but native to the Azores (termed as native henceforth), or exotic species, and higher taxonomic levels, such as family, order, and class, were also assigned to them. For some analysis, natives and endemics were merged and referred together as ‘indigenous’ species. Species whose biogeographic origin was unknown remained included in the overall species numbers but they were not categorized into either indigenous or exotics and thus they did not inflate the number of any of those groups.
The union of the two (BALA I and BALA II) networks (i.e., merging all nodes and edges from both networks), a meta-network, consisting of species (represented as nodes) and their significant associations (represented as positive or negative links or edges) served as the base of our further analysis. Edge weights for the meta-network were calculated by averaging the two edge weights from BALA I and BALA II subnetworks.
This meta-network was further split to ‘island subnetworks’ as well as to ‘site subnetworks’ by keeping only species and their related links which were present in a particular island or at a sampling site, respectively. Island subnetworks were used to calculate overall metrics of association networks at each island and site subnetworks were used in all other network comparisons. From each site subnetwork, two theoretical association networks were also generated: one with exotic and one with indigenous species excluded (Supplementary Figure S1). While the probability of finding these purely exotic and indigenous networks in real life is extremely low, they can serve for analytical purposes to pinpoint differences in association network assembly rules between the two biogeographical groups.
2.3. Network statistical analysis
A series of 999 Erdős-Rényi random graphs with the same node number as our meta-network were generated, their degree distributions were calculated and compared to the empirical degree distribution of our meta-network to estimate the probability that our co-occurrence network is a random graph.
Commonly used measures to characterize network topological properties, such as the number of nodes and edges, connectance, proportion of negative links, the proportion of isolated nodes, mean closeness and betweenness centralities, and modularity (based on the ‘edge betweenness’ community detection algorithm) were calculated. Similarly, node characteristics, such as the number of edges connecting other nodes (degree), the proportion of degree to the number of all nodes (relative degree); the number of negative edges (vulnerability) and the proportion of those to the relative degree (relative vulnerability); betweenness, closeness centralities were also computed, with the help of the igraph package (Csárdi and Nepusz, 2006; Supplementary Table S1). Since most of these measures strongly depend on the number of nodes (i.e., show high correlation), a z-score normalized version of each centrality measure was also calculated. During the process of excluding highly correlating variables (Spearman’s p < 0.05,|Spearman’s Rho| > 0.6) non-normalized versions of these variables were discarded and only normalized values were included in the analysis.
Site networks were used as replicates to compare island networks and to investigate their relationship to the island area, the total native forest area, and the native forest to island area ratio, as well as to island-specific climatic variables and the number of exotics and their ratio to the total species richness on the islands. Since there is no settled methodology to compare networks, island networks were compared based on: (1) the Jaccard distances between their associated adjacency matrices; and (2) the differences in their calculated network properties. In this latter case, similarity matrices were calculated using the Euclidean distances of z-score scaled network properties. Environmental variables were also z-score scaled and a stepwise redundancy analysis (dbRDA) process was conducted to find the optimal model. Whether or not island networks topologies were significantly different was tested using the corresponding distance matrices in an Analysis of Similarities (ANOSIM) test with 10,000 permutations, with the help of the anosim() function implemented in the vegan (Oksanen et al., 2010) R package. To control Type I Error arising from multiple comparisons, p-values in pairwise comparisons were adjusted using the false discovery rate (FDR) correction.
To test if link formation between either combination of endemic, native, and introduced species occurred non-randomly, we generated 5,000 networks in an iterative process with keeping the original network structure but randomly assigning the origin status to species. The proportion of each combination pair to the overall link number was calculated and one-sample t-tests were used to compute p-values to determine if association frequencies between categories of native status can be random. A similar permutational approach was used to test whether or not some combinations of categories of native status are more or less likely to collect negative links than it would be expected from random processes. In this latter case though the ratio of the negative links to the number of links within each combination pair was calculated and compared to the randomized distribution, using one-sample t-tests. To investigate if there are differences in the frequency of endemic, native, and introduced species having association links with each other, we compared the number of links between each combination using Kruskal-Wallis tests, and pairwise Wilcox-tests with p-values adjusted according to the FDR method.
The relationship between major network topology measures and the number and the proportion of exotics in the communities was investigated using linear mixed models with the island identity set as the random term using the lmer() function in the lme4 package (Bates et al., 2015, 4). All proportion variables were square-root transformed prior to regression to approximate normality. P-values were estimated according to Satterthwaite’s method, as implemented in the lmerTest package (Kuznetsova et al., 2017) in R. Marginal and the conditional R2 values were extracted using the r.squaredGLMM() function in the MuMIn package (Barton, 2020). Since indigenous and exotic species richnesses are strongly correlated, the separate effect of exotic species richness on the networks cannot be disentangled easily. Thus, besides using raw richnesses, we also took a more complex approach: we fitted similar models as above on networks consisting of indigenous species only and used the residuals from these models as the response variables modeled against the number of exotic species in indigenous only networks.
Both network-related and node-related properties were compared between native and exotic species using Kruskal-Wallis tests and pairwise Wilcox tests with p-values adjusted for multiple testing according to the FDR method. Linear mixed-models as above were used to investigate the effect of exotics (both number and proportion in the whole community) on indigenous networks only.
The entire process, from data clearing through, network generation and analysis, to graphical representation was conducted in an R programming environment (R Core Team, 2012) with highly relying on ggplot (Wickham, 2016), phyloseq (McMurdie and Holmes, 2013), reshape (Wickham, 2007), and vegan (Oksanen et al., 2010) packages.
3. Results
Our initial meta-network consisted of 145 nodes (species) and 330 edges, giving a 0.031 edge density value. Of all species, 93 (50 endemics and 43 natives) were indigenous, 50 exotics, and 2 with an unknown origin. Positive associations dominated the meta-network (191 and 139 positive and negative links, respectively). The edge density and degree distribution of our meta-network were significantly different from those that are likely to arise from random networks (p < 0.001). The degree of nodes ranged from 1 to 28 with Cixius azoterceirae Remane & Asche, 1979, a tree lacehopper species endemic to the Azores, having the highest degree. The same species also had the most negative links to other species, along with Leiobunum blackwalli Meade, 1861 (a native harvestman) and Lasius grandis Forel, 1909 (a native ant) (Figure 2; Supplementary Data S1).
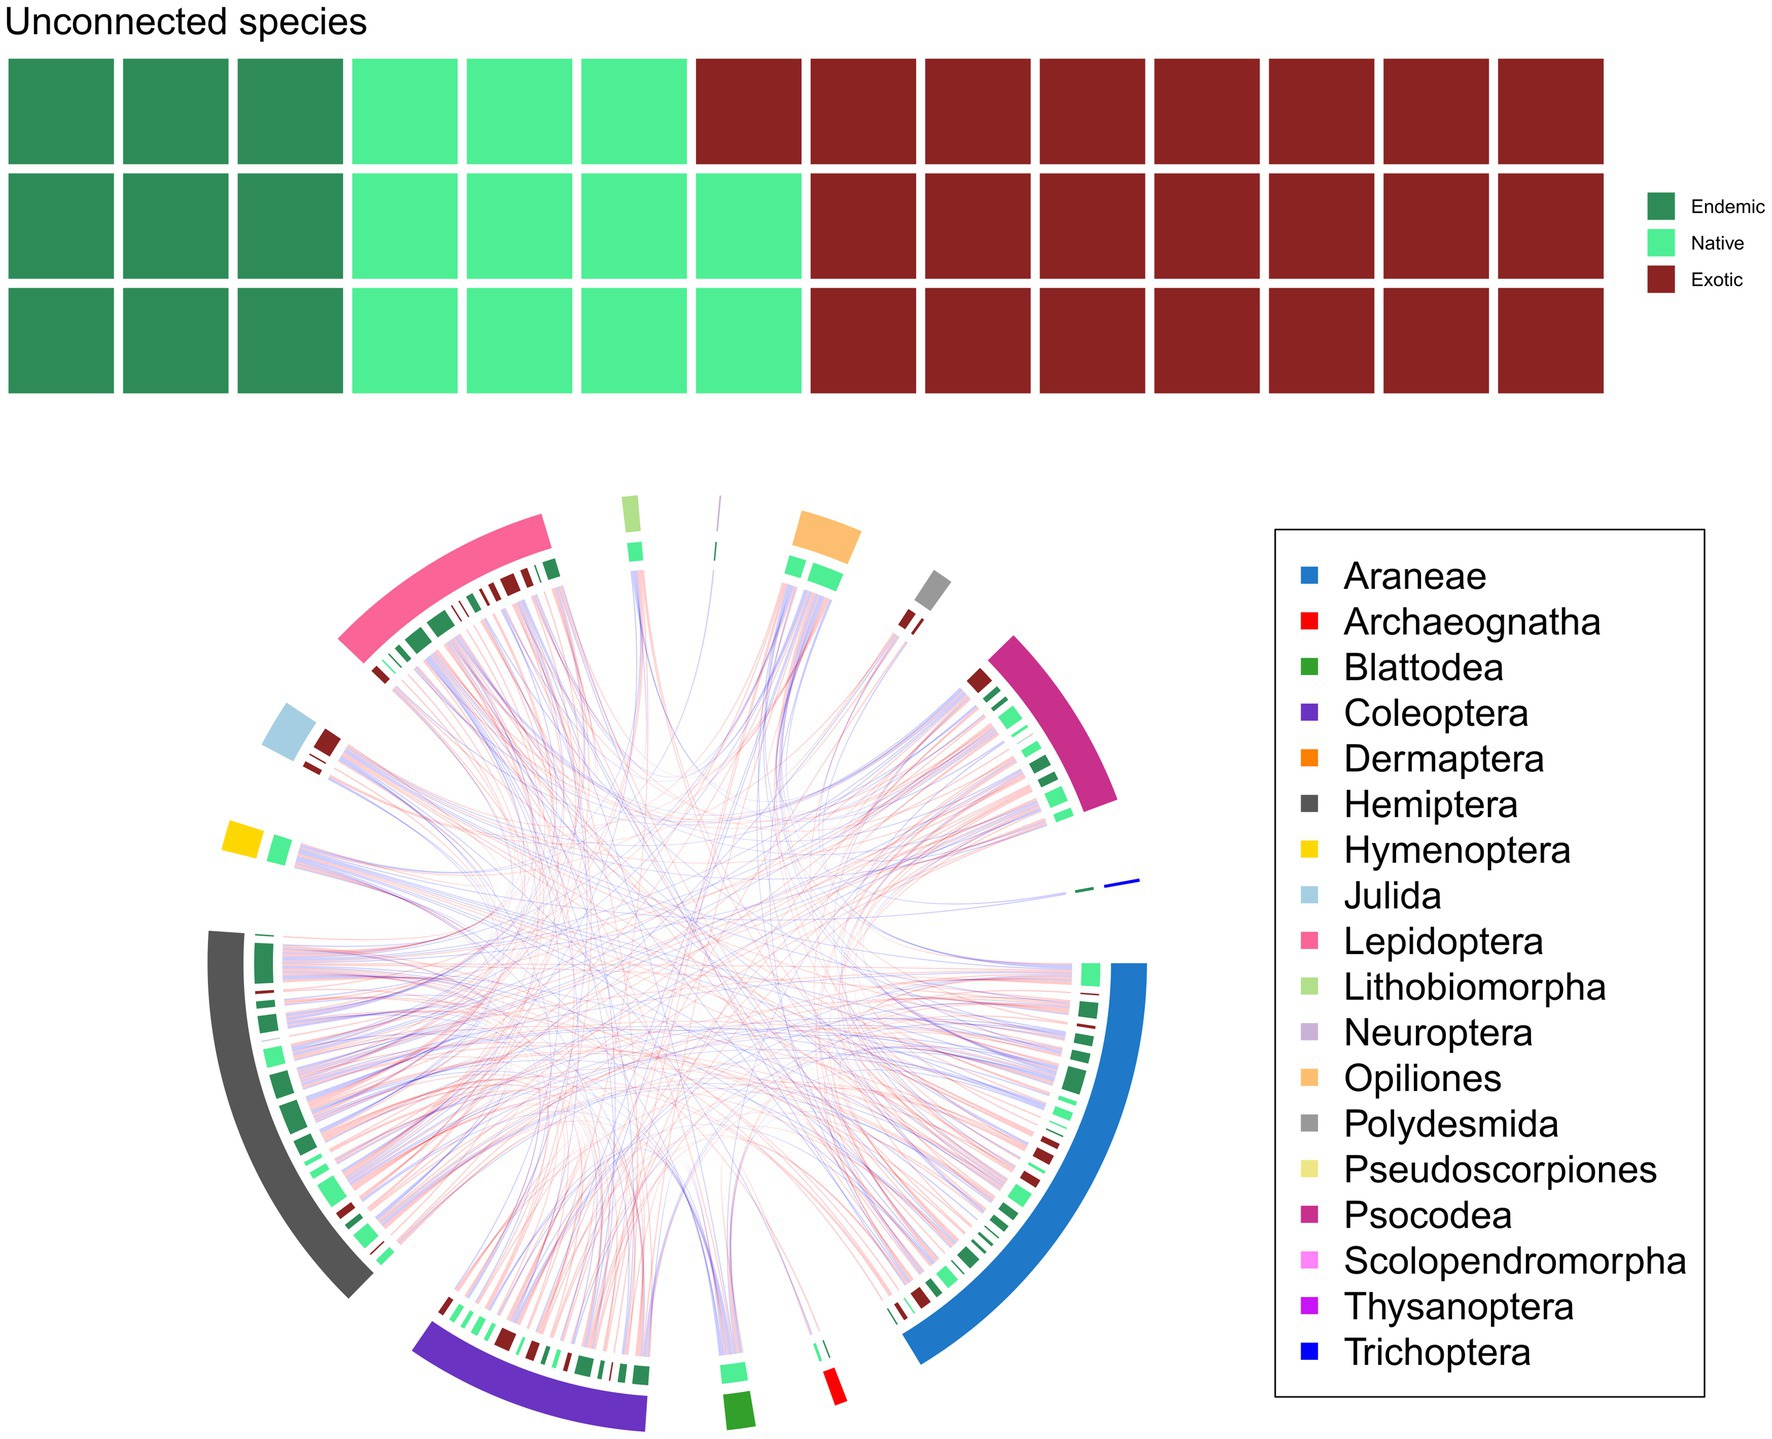
Figure 2. The meta-network, colored according to higher taxa and nativity classes (A), and the number of isolated species, grouped to endemics, natives, exotics, and unknown origins. Each square represents one species. (B). Red links in the network represent positive, blue links negative associations. Outer arc shows arthropod orders, inner arc the nativity classes. Arc segment length is proportional to the number of nodes the group has.
3.1. Differences in island network topologies and driving factors
Islands networks significantly differed based on their topology measures (ANOSIM p < 0.001, R = 0.274). After correcting for multiple comparisons, several pairwise differences between islands still remained significant at the p ≤ 0.05 significance threshold (Figures 3A,B). Although the number of nodes and the number of edges were significantly different between islands (Kruskal-Wallis test, p = 0.05 and p = 0.01, respectively), their pairwise differences were not supported statistically. The relative vulnerability and modularity, on the other hand, showed no significant differences (Supplementary Figure S2). The number and proportion of the exotics on the islands, modeled mean altitude, summer median temperature, and the relative humidity were the main factors driving these differences. The proportion of the area of the natural forest patch to the overall island area were also significant (dbRDA model was significant at the p = 0.001 level and explained 25.8% of constrained inertia) (Figure 3A). When island networks were compared based on their association pairs, they differed significantly (ANOSIM p < 0.001, R = 0.646) but differences between individual islands were different than those when island networks were compared based on their topology measures (Figures 3C,D). The major factors driving these differences were the modeled mean altitude, the annual mean temperature and precipitation, and the median and minimum summer temperate and precipitation (respectively) (dbRDA model was significant at the p = 0.001 level and explained 35.99% of constrained inertia).
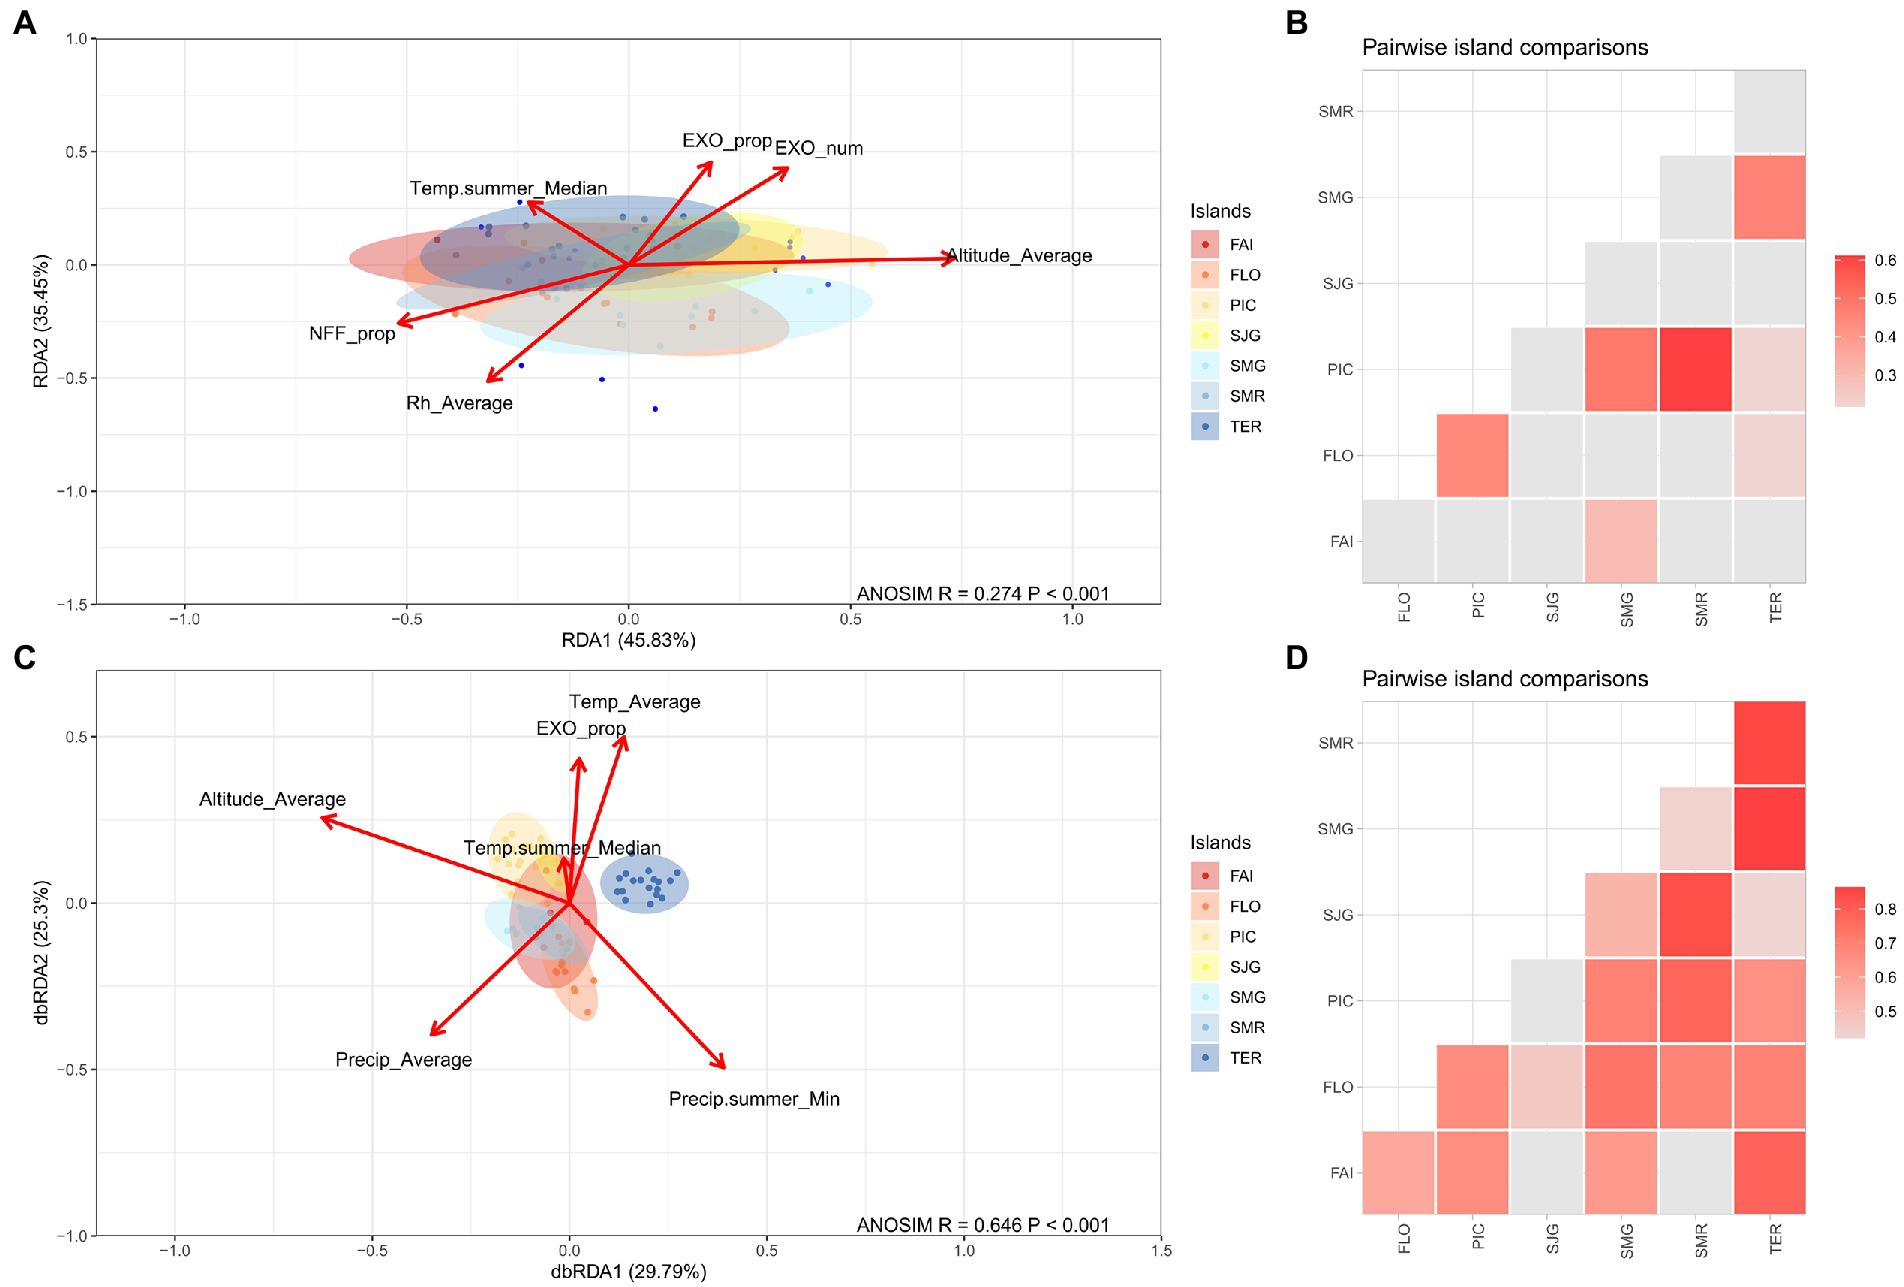
Figure 3. The ordination and pairwise ANOSIM comparison of the island subnetworks based on their network properties (A,B, respectively) and their species pair community (C,D, respectively).
3.2. Effects of exotics on network topology
Simulations suggested that endemic to endemic, endemic to native, and native to native edges were less common in the meta-network than could have arisen in networks with randomly reshuffled nativity categories. Endemics had a lower chance than expected to have negative links to both introduced and native species, as did natives to other natives. At the same time, introduced species were more linked to the other groups than expected by chance, including themselves. All other combination pairs showed a significantly greater chance than random to have a higher proportion of negative links with each other (Supplementary Results A–D). When linking frequencies were compared, endemic to endemic, native to native and endemic to native links occurred in greater proportions than introduced to introduced, and introduced to endemic (Figures 4A, B). In terms of the proportion of negative links, natives had negative associations with themselves and with endemics in significantly higher proportions than any other combinations but endemics with introduced species. Endemic to endemic negative links occurred in a significantly lower proportion than endemic to introduced ones (Figures 4C, D).
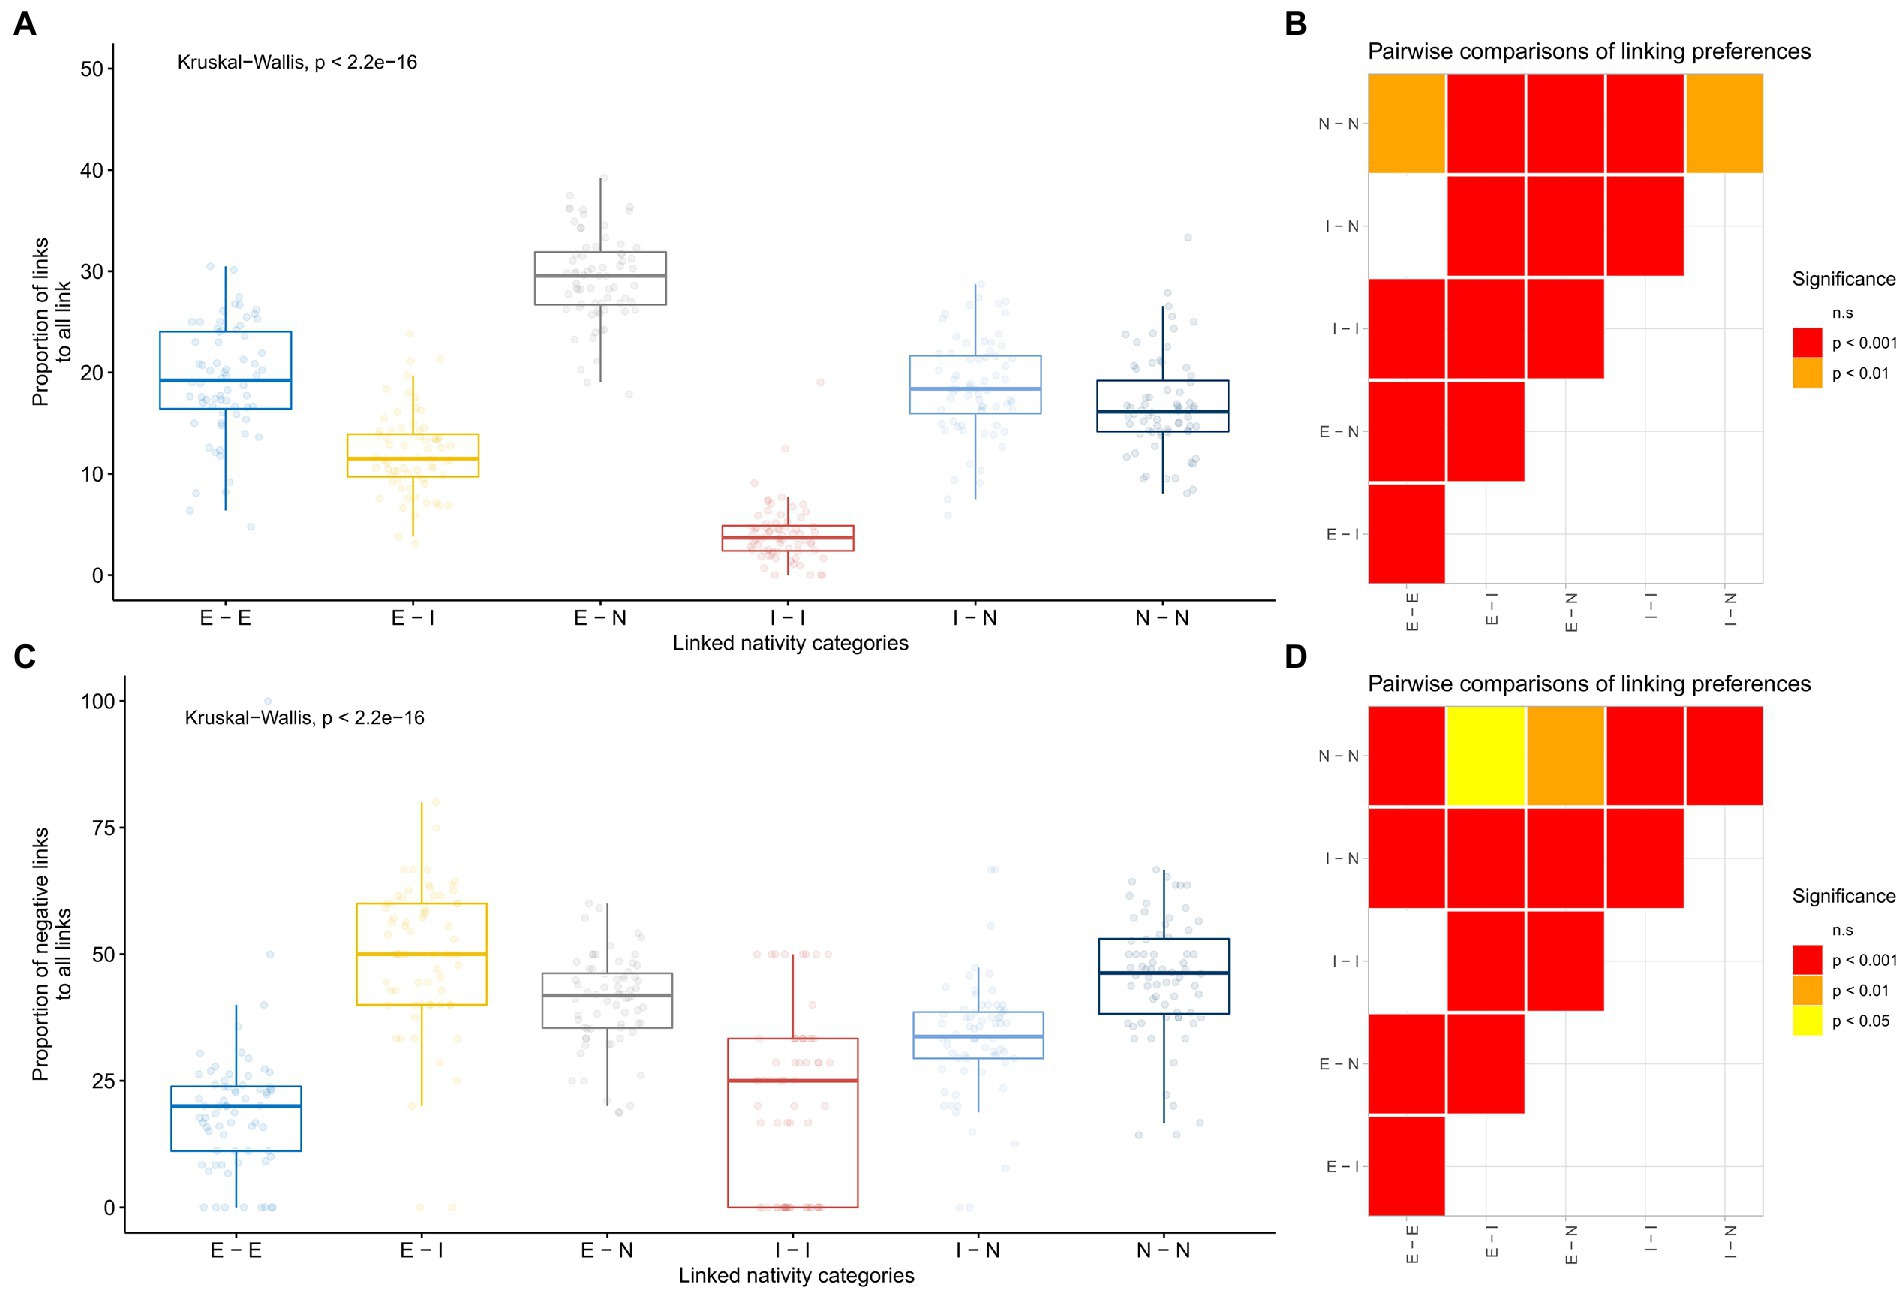
Figure 4. Preferential linking between endemic, native, and exotic species. The distribution of the proportion of both positive and negative links (A), and negative links only (C) to all links between nativity category pairs. Pairwise comparisons using pairwise Wilcox tests are shown on the right side (B,D, respectively). All p-values of pairwise Wilcox tests are adjusted according to the FDR method.
Both the number of nodes and edges, as well as the ratios of negative edges and isolated nodes showed significantly positive relationships with the number of exotics in the networks. On the contrary, the connectance showed a negative relationship, and neither the normalized closeness and betweenness centralities nor modularity showed significant relationships (Table 1; Supplementary Figure S3). However, when relationships between these measures and the proportion of exotic species in the community were tested, only the number of nodes, the proportion of isolated nodes and normalized closeness centrality revealed significantly positive relationships but the mean degree, connectance, and modularity showed significantly negative relationships (Supplementary Figure S4). Relationships showed similar patterns when the proportions of exotics were fitted against the residuals of the model fitted on the proportions of exotics against the properties of indigenous-only networks (Table 1).
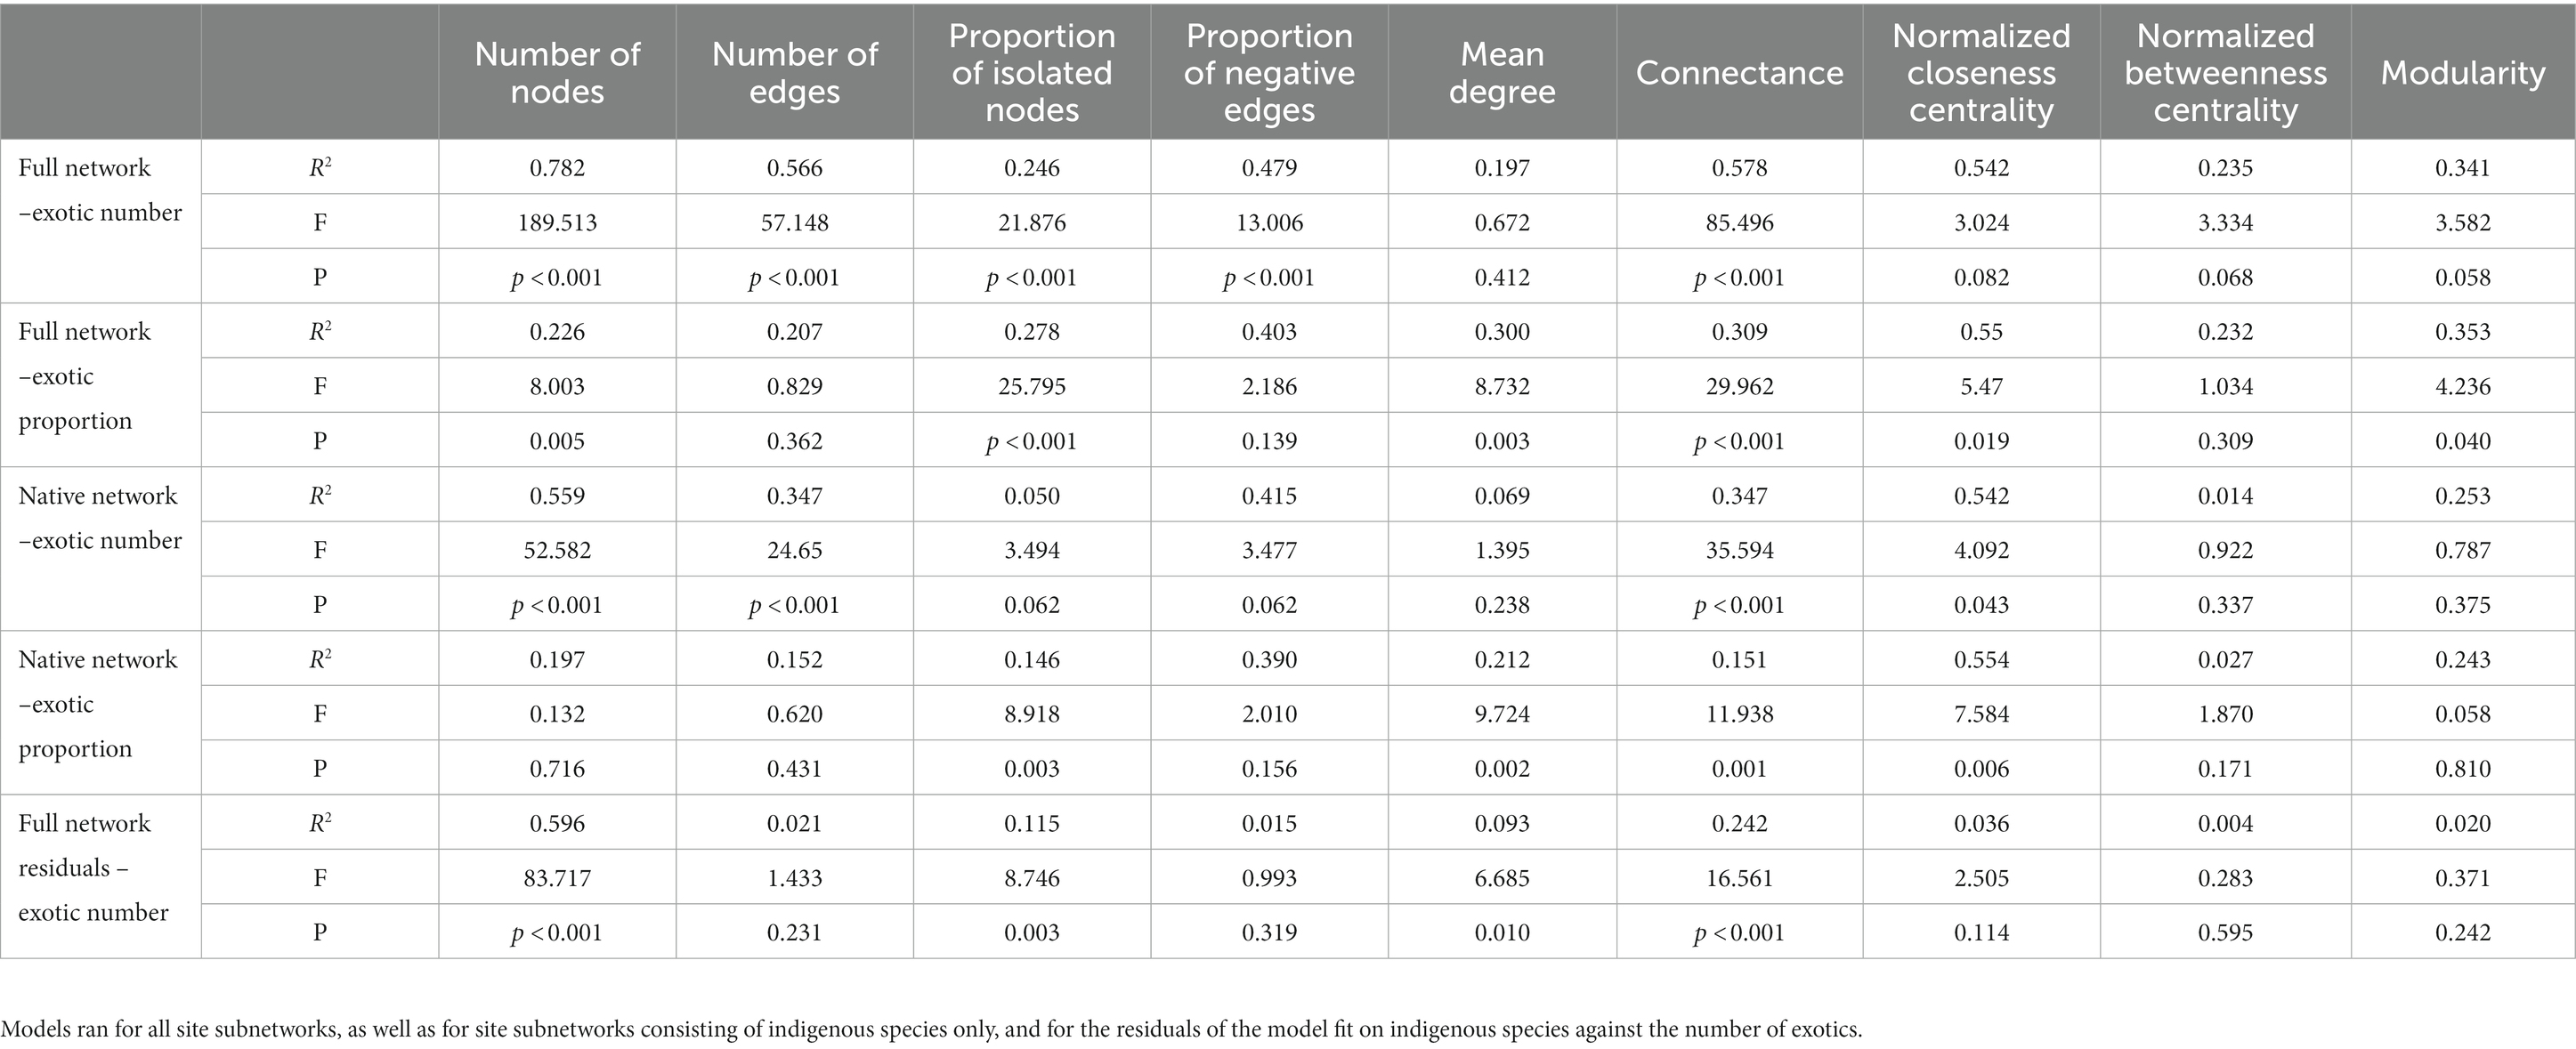
Table 1. R2, F statistic, and its associated p-values for each network parameter as a function of the number and proportion of exotics in the community.
3.3. Differences between the node properties of indigenous and exotic species
No significant relationships were found in node properties between exotic and indigenous species, neither when all species were included in the analysis nor when isolated ones (degree = 0) were excluded (Supplementary Figure S5).
3.4. Differences in native and exotic networks
When island subnetworks were split into theoretical networks consisting of only indigenous or exotic species, differences emerged. Since there were more indigenous than exotic species and network topology measures highly correlated to node number, some measures, such as the number of edges, the number of positive links, and the mean degree, were also significantly greater for indigenous networks. Albeit they had no or little correlation to the number of nodes, the proportion of isolated nodes, the proportion of negative edges, and the connectance also showed differences (Figure 5).
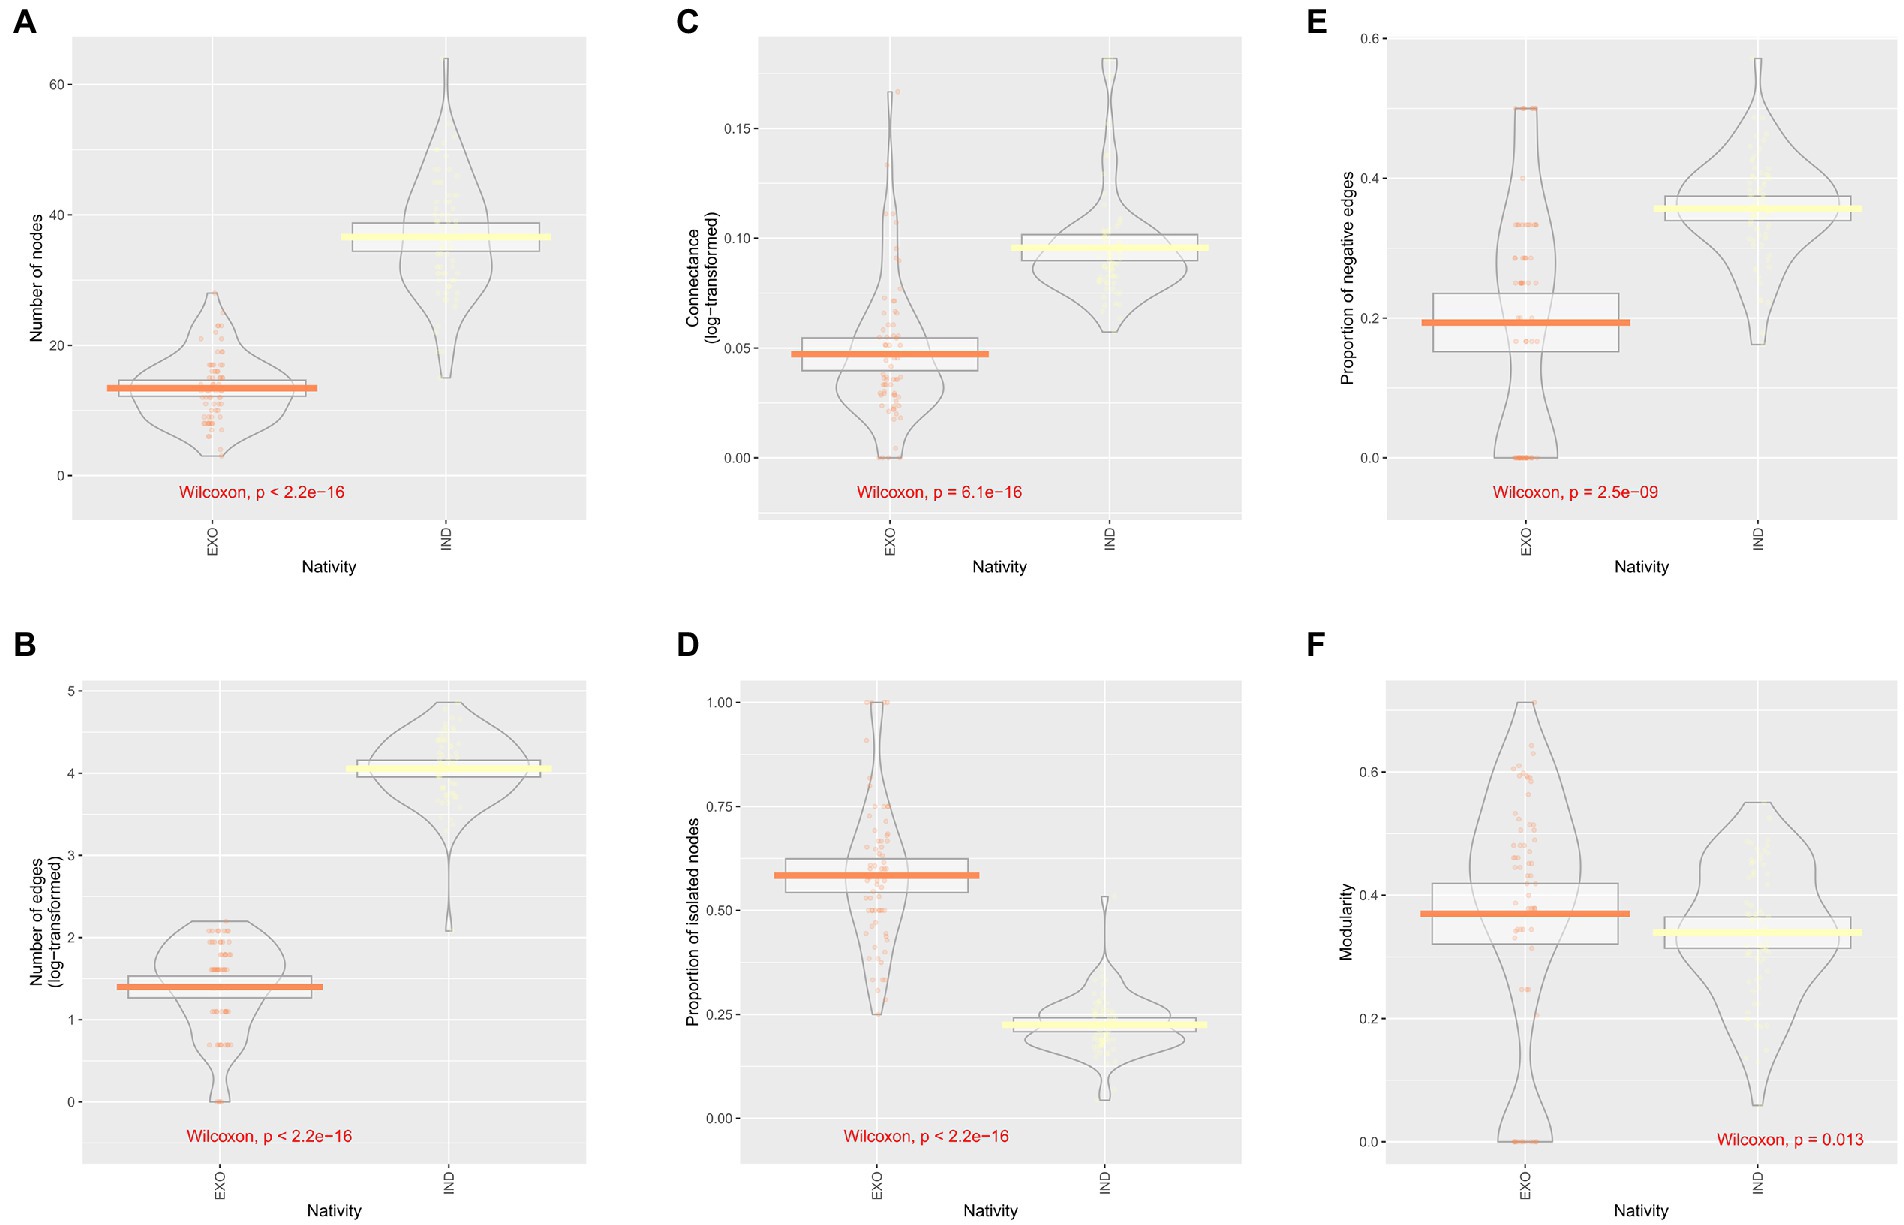
Figure 5. Comparison of network properties between indigenous-only and exotic-only networks: number of nodes in the network (A), number of edges in the networks (B), the log-transformed value of connectance (C), the proportion of the isolated nodes (D), the proportion of negative edges (E), and the modularity based on the ‘edge betweenness’ community detection algorithm (F).
When we investigated the effects of exotics on indigenous networks only, we found that the proportion of exotics in the assemblages had a negative relationship with the mean degree and the connectance of the theoretical network purely consisting of indigenous species. A positive relationship was visible between the proportion of exotics and the proportion of isolated nodes, as well as the normalized closeness and eigenvector centralities (Supplementary Figure S6).
4. Discussion
In this study, we analyzed arthropod co-occurrence networks on seven Azorean islands and tested the hypotheses that the structure of these networks reflects biogeographical patterns, is sensitive to abiotic environmental differences, and that the networks’ topological features echo the imprint of exotic species in the community.
We found that co-occurrence networks of island arthropods showed non-random structuring patterns, and that biogeography (i.e., island identity) was reflected on the network structure both when network topological properties and when species pairs, as network building blocks, were compared (H1). Both of our first and second predictions (P1, P2) that natural habitat size and abiotic factors drive network structure in concert, were supported by the multivariate model. Thus, co-occurrence network analysis seems to be suitable to detect inter-island differences and the dependence of network topology on environmental factors is clear. This is particularly important because the environmental effects constraining species co-occurrences were accounted for during our network generation process and their impact on detecting associations minimized.
Since island species richness is reported to depend on the size of the island (Whittaker et al., 2017), and natural habitat remnants behave as islands themselves (Matthews, 2021), we predicted that natural habitat patch size will influence the structure of the association networks, mainly through new links with unique species found on each island. Yet, our results showed that the size of natural habitat has lower importance in shaping co-occurrence networks than they have in driving community differences in indigenous Macaronesian spiders (Cardoso et al., 2010), particularly when networks were compared based on their associated species pairs. However, Cardoso et al. (2010) excluded exotic species from their analysis, and in our cases, the number of exotics was highly influential in both models (i.e., the one comparing network topologies and the other comparing networks based on associated species pairs), which can explain the disagreement with their findings. Moreover, in our study, there was a moderately strong correlation between native forest patch size and the number of exotics, which may have further obscured the clear effect of forest patch size. Nevertheless, native habitat area and the proportion of pristine habitats to the overall island area showed few, and moderately strong, correlations with network properties (Supplementary Figures S7–S9), suggesting a limited power of this variable to predict networks topologies.
Both the number and the proportion of exotics in the community influenced the topology of the co-occurrence networks (H3). Although the species-area relationship (Whittaker et al., 2017) suggests that the number of species (i.e., nodes) should increase with the island area, we did not find a significant correlation. This, possibly, happened because the rare species, which are the most likely to increase species richness, were removed prior to analysis and, thus, they did not contribute in forming the networks. The number of exotic species, however, positively correlated with the island area, which is in line with the findings of Whittaker et al. (2014), who reported an increasing number of exotics with increasing island area for both spiders and beetles in the Azores. However, the higher number of exotics in larger islands may also be explained by more active commercial trading in those islands. The proportional increase of edges did not match the increase of exotic nodes though, mostly because the newly recruited exotics in the communities have no or few links to other species (i.e., the proportion of isolated increased). This resulted in a general decline in the connectance, the opposite way we predicted (P4). Yet, we did not detect a significant increase in the modularity (but detected a significant decrease with the increasing proportion of exotics), which is most likely the result of the community detection algorithm we used does not considering isolated nodes (Clauset et al., 2004). The declining trend in connectance and the increase of isolated nodes were more pronounced after the effect of indigenous species had been removed, suggesting that indigenous species mitigate changes in association network structure. The fact that the proportion of negative links did not show a significant relationship either as a function of the residuals after the effect of natives had been removed, or when the proportion of the exotics was investigated (i.e., P5 did not hold up), suggests that these species are rarely involved in direct competition with indigenous ones. This pattern, and the high proportion of unconnected exotic species, on one hand, may also suggest that the majority of the exotics do not occur in samples regularly enough to form detectable associations with other species; only a few, dominant, exotics contribute to shaping network topologies (Kay et al., 2018). This is in line with Florencio et al. (2015) who found that faunal homogenization in the Azores was not apparent from incidence-based community nestedness investigations, and reasoned that although the prevalence of dominant exotic species was high, rare exotic species were replaced both in space and time. On the other hand, our results support the earlier findings (Whittaker et al., 2014) that exotics, instead of competing with indigenous, occupied empty niches and increased the realized trait space of the community (Rigal et al., 2018).
We also showed a strong preferential linking in the community, and consequently, the assembly structure was not random (H2). Endemic and native species linked to each other frequently than to exotics to exotics and endemics to exotics. This is somewhat counter to what we expected, that, since exotics are habitat generalists and occur in many habitats, they will regularly show associations with all other species (including negative ones). Indeed, in a previous study using part of our data, Gaston et al. (2006) found that although introduced species have low abundances and occupy fewer sites, they lie on the same bivariate abundance–variance and abundance–occupancy plots in a somewhat random way. While it can be speculated that the relatively low prevalence of exotic species did not reach the association detection threshold of the algorithm, the lack of difference between the probability of introduced species linking to natives and endemics linking to endemics does not support this hypothesis. An alternative hypothesis may be that the abundance of introduced species varies greatly among sites and therefore no clear association pattern can be found with other species. Indeed, although native habitat fragments are relatively small, most exotic species may not reach the locations toward the center of patches where indigenous are frequent in high enough abundances to show association patterns (see Borges et al., 2006; Tsafack et al., 2023). Those exotics though which are highly abundant have a negative effect on the endemic fauna which results in a high number of negative associations between endemics and introduced species. Whether this pattern is a result of the resistance of local communities to exotics or other causes is yet to be investigated. Native species were not notably negatively associated with exotics and, although the associations between endemic and introduced species showed the highest proportion of negative links to all links, these two groups were altogether relatively rarely associated, which still suggests a low to moderate niche overlap and competition to indigenous species in the Azores (e.g., Heleno et al., 2013).
Networks consisting of solely indigenous or exotic species also differed, as we predicted (P3). Although the node properties of exotic species did not differ from those of indigenous, the theoretical networks consisting of exotics only showed a generally lower number of links to other species. This low degree resulted in lower connectance and centralities, and a greater proportion of isolated nodes in exotic-only networks, compared to native-only networks. As a consequence, connectance, indeed, decreased and the number of isolated species (nodes) increased with the increase of the number and proportion of exotic species in communities. Moreover, the proportion of negative links in all networks showed a significant positive relationship with the number, but not with the proportion of exotics in the community. Although, as seen above, these can be the results of exotic species blending into indigenous communities without competing with indigenous species, from the low connectance of exotic networks we also may speculate to their lower stability and resilience (Dunne et al., 2002; Okuyama and Holland, 2008).
Indeed, as a number of systems show early signs of disintegration when stressed, particularly the weak links tend to break easily (Csermely, 2004), increasing modularity is anticipated. Alarmingly, in our native-only networks, the connectance decreased with the increasing proportion of exotics in the community, as did the proportion of isolated nodes. These suggest an obscure process of disintegration of native association networks, driven by the increasing proportion of exotics, which, eventually may grow into a regime shift (Rocha et al., 2015; Hui and Richardson, 2018). This is in line with Larson et al. (2016) and Hui (2021) who showed that plant-pollinator interactions and fruit-bird mutualistic networks (respectively) change in a similar manner when invaded by introduced species. Although co-occurrence networks cannot be translated to interactions (Blanchet et al., 2020), species pairs that do not co-occur frequently enough cannot interact either, and hence these findings are highly concerning and in accordance with the recent observation that exotic species diversity is increasing in Azorean native forests (Borges et al., 2020). Moreover, in the native only theoretical networks with the increasing proportion of exotics the closeness centrality increased, indicating that less connected species disappeared first, reinforcing the estimations by Triantis et al. (2010) for a high level of extinction debt on the Azores.
Nonetheless, since network topologies may correlate with unmeasured environmental factors, for instance, the adjacent landscape of the natural forest patch, other drivers may also be in action. Thus, before routinely anticipating causality between exotic species’ number and node properties and native species richness, the underlying causes should be thoroughly investigated.
Our study provided ample evidence that island arthropod co-occurrence networks are sensitive to the presence of exotic species and that the networks of exotic species differ from those of natives. These structural sensitivities can make species co-occurrence networks ideal tools for providing early warning signals of community changes induced by exotics, and thus tools for monitoring and conservation. These signaling systems in the Anthropocene are timely and essential to detect and mitigate deleterious effects of human-induced environmental change on native habitats (Derocles et al., 2018; Fath et al., 2019). As a matter of fact, in the last decades, the amount of biodiversity data multiplied, partly due to the advanced recording technology (e.g., metabarcoding, environmental DNA), but also due to citizen science efforts, and these, so far, untapped data provide an opportunity to be utilized for co-occurrence network analysis and advance the understanding of large-scale ecological assembly rules and geographic patterns of communities (Lima-Mendez et al., 2015; Ma et al., 2016). At the same time, early warning systems for conservation purposes could also be developed by utilizing simple count data to detect changes in association networks, such as those caused by the spread of exotics. A cautious approach has to be taken though. In our case, for instance, negative links between species did not provide a useful measure for the effect of invasive species, most likely because, as we speculated, the exotic arthropods on the Azores naturalized relatively well and managed to exploit previously unoccupied niches causing little competition with natives, as it was reported in the case of disturbed landscape such as managed pastures (Rigal et al., 2018). Whether or not this process drives the patterns we found in native forests, can only be teased apart through targeted field experiments.
4.1. Limitations
One of the main limitations of this study is inevitably derived from limitations of the method used; although association networks are relatively easy to construct, they are not real-life interaction networks, but merely the predictions of them (Blanchet et al., 2020; Strydom et al., 2021). However, with the method we chose, we attempted filter off species associations which are the mere result of similar habitat requirements. Moreover, our sampling transects were relatively small (150 m), and thus arthropods, other than those with extremely low mobility or with restricted microhabitat requirements, are likely to frequently interact at that spatial scale. Moreover, to confirm if the associations we found can predict real-life interactions, we searched the literature to see if the negative associations we found can ecologically be justified based on already published data. We found a strong support for most negative interactions as intraguild predation (negative association between spiders), antagonistic interactions with ants, and competition between hemipterans. Yet, further targeted tests or literature searches should be conducted to prove or disprove the existence of predicted interactions. A further issue with the method may be, from the missing links’ perspective, that even though species co-occur, and thus they also potentially can interact, if this co-occurrence does not happen frequently enough the model based on correlating abundancies will not recognize those co-occurrences as associations. Furthermore, species co-occurring because of similar environmental requirements can still potentially interact but, since the association can be explained by an environmental variable, it will not be registered as an edge in the final network.
Although the temporal dynamism of these networks is accounted for in our study (two separate networks were generated for the two temporally separated sampling rounds), deep dynamical processes, for instance whether or how associations change seasonally, are not analyzed. This limitation is the direct consequence of the lack of underpinning long-term datasets. This deficiency restricts our understanding of processes overarching several decades, such as climate change, the temporal patterns of exotic invasions, or continuous anthropogenic pressure, and likely prevents timely action to mitigate them (Poisot et al., 2015; Tulloch et al., 2016). Moreover, species co-occurrence networks may also depend on the seasonal dynamics of species of which we have little information. In this study, we did not focus on differences resulting from taxonomical or functional grouping but these, most likely, exist. Whereas this approach would plausibly be a fruitful area of research, a complete dataset of traits is crucial and, besides taxonomy, a phylogenetic tree would also be desirable.
5. Conclusion
Here we show that changes in the topologies of arthropod co-occurrence networks in the Azores mirror variances both in biotic and abiotic environments and thus they can help to gain a deeper insight into natural and anthropogenic processes shaping island biogeography. Our findings suggest that although Azorean exotic species have little competition to indigenous, their presence affects species association networks and induce reorganizations. Thus, developing standardized network assessment methods and utilizing network information may help in developing early warning systems for detecting the perilous impact of exotic species (Fath et al., 2019). Combining modern metabarcoding techniques and standardized statistical methods for association network-building with cutting-edge machine learning processes and literature-based trait data to routinely identify real-life interaction networks would substantially advance our understanding of ecological assembly rules and improve our predicting power to anticipate the future status of communities of high conservation interest (Evans et al., 2016). Fully exploiting this toolkit is vital for island biodiversity conservation.
Data availability statement
The original contributions presented in the study are included in the article/Supplementary material, and species list and distribution data are openly available in Borges et al. (2016). Computer codes, along with summary environmental data can be downloaded from the https://github.com/pozsgaig/azores_exotic_cooccurences GitHub repository. Any further inquiries can be directed to the corresponding author.
Author contributions
GP conceptualized the study. PB established the sampling protocol. PB, RG, PC, FR, and MB collected the arthropods which were then identified by PB. EA provided environmental data. GP did the formal analysis and wrote the first draft. All authors edited and agreed the later versions of the manuscript.
Funding
This work was funded by a Research Program Contract for the Center for Ecology, Evolution and Environmental Changes (cE3c), through programmatic funding with a contract to GP (FCT-UIDP/00329/2020) and research pluriannual funds for cE3c (FCT-UIDB/00329/2020). MB was supported by the contract from DL57/2016/CP1375/CT0001.
Acknowledgments
We are grateful to all colleagues who contributed to the data acquisition during BALA 1 and BALA 2 fieldwork.
Conflict of interest
The authors declare that the research was conducted in the absence of any commercial or financial relationships that could be construed as a potential conflict of interest.
Publisher’s note
All claims expressed in this article are solely those of the authors and do not necessarily represent those of their affiliated organizations, or those of the publisher, the editors and the reviewers. Any product that may be evaluated in this article, or claim that may be made by its manufacturer, is not guaranteed or endorsed by the publisher.
Supplementary material
The Supplementary material for this article can be found online at: https://www.frontiersin.org/articles/10.3389/fevo.2023.1139285/full#supplementary-material
References
Albrecht, J., Gertrud Berens, D., Jaroszewicz, B., Selva, N., Brandl, R., and Farwig, N. (2014). Correlated loss of ecosystem services in coupled mutualistic networks. Nat. Commun. 5:3810. doi: 10.1038/ncomms4810
Araújo, M. B., and Rozenfeld, A. (2014). The geographic scaling of biotic interactions. Ecography 37, 406–415. doi: 10.1111/j.1600-0587.2013.00643.x
Araújo, M. B., Rozenfeld, A., Rahbek, C., and Marquet, P. A. (2011). Using species co-occurrence networks to assess the impacts of climate change. Ecography 34, 897–908. doi: 10.1111/j.1600-0587.2011.06919.x
Azevedo, E. B., Santos Pereira, L., and Itier, B. (1999). Modelling the local climate in island environments: water balance applications. Agric. Water Manag. 40, 393–403. doi: 10.1016/S0378-3774(99)00012-8
Barton, K.. (2020). MuMIn: Multi-model inference. Available at: https://CRAN.R-project.org/package=MuMIn (Accessed September 26, 2022).
Bates, D., Mächler, M., Bolker, B., and Walker, S. (2015). Fitting linear mixed-effects models using lme4. J. Stat. Softw. 67, 1–48. doi: 10.18637/jss.v067.i01
Blanchet, F. G., Cazelles, K., and Gravel, D. (2020). Co-occurrence is not evidence of ecological interactions. Ecol. Lett. 23, 1050–1063. doi: 10.1111/ele.13525
Bohan, D. A., Caron-Lormier, G., Muggleton, S., Raybould, A., and Tamaddoni-Nezhad, A. (2011). Automated discovery of food webs from ecological data using logic-based machine learning. PLoS One 6:e29028. doi: 10.1371/journal.pone.0029028
Bohan, D. A., Vacher, C., Tamaddoni-Nezhad, A., Raybould, A., Dumbrell, A. J., and Woodward, G. (2017). Next-generation global biomonitoring: large-scale, automated reconstruction of ecological networks. Trends Ecol. Evol. 32, 477–487. doi: 10.1016/j.tree.2017.03.001
Borges, P. A. V., Aguiar, C., Amaral, J., Amorim, I. R., André, G., Arraiol, A., et al. (2005). Ranking protected areas in the Azores using standardised sampling of soil epigean arthropods. Biodivers. Conserv. 14, 2029–2060. doi: 10.1007/s10531-004-4283-y
Borges, P. A. V., Gabriel, R., Arroz, A. M., Costa, A., Cunha, R. T., Silva, L., et al. (2010). The Azorean biodiversity portal: an internet database for regional biodiversity outreach. Syst. Biodivers. 8, 423–434. doi: 10.1080/14772000.2010.514306
Borges, P. A. V., Gabriel, R., and Fattorini, S. (2019). “Biodiversity erosion: causes and consequences” in Life on Land. eds. W. Leal Filho, A. M. Azul, L. Brandli, P. G. Özuyar, and T. Wall (Cham, Switzerland: Springer Nature), 1–10.
Borges, P., Gaspar, C., Crespo, L. C., Rigal, F., Cardoso, P., Pereira, F., et al. (2016). New records and detailed distribution and abundance of selected arthropod species collected between 1999 and 2011 in Azorean native forests. Biodiver. Data J. 4:e10948. doi: 10.3897/BDJ.4.e10948
Borges, P. A. V., Lobo, J. M., Azevedo, E. B., Gaspar, C. S., Melo, C., and Nunes, L. V. (2006). Invasibility and species richness of island endemic arthropods: a general model of endemic vs. exotic species. J. Biogeogr. 33, 169–187. doi: 10.1111/j.1365-2699.2005.01324.x
Borges, P. A. V., Rigal, F., Ros-Prieto, A., and Cardoso, P. (2020). Increase of insular exotic arthropod diversity is a fundamental dimension of the current biodiversity crisis. Insect Conserv. Divers 13, 508–518. doi: 10.1111/icad.12431
Burkle, L. A., Marlin, J. C., and Knight, T. M. (2013). Plant-pollinator interactions over 120 years: loss of species, co-occurrence, and function. Science 339, 1611–1615. doi: 10.1126/science.1232728
Cardoso, P., Arnedo, M. A., Triantis, K. A., and Borges, P. A. V. (2010). Drivers of diversity in Macaronesian spiders and the role of species extinctions. J. Biogeogr. 37, 1034–1046. doi: 10.1111/j.1365-2699.2009.02264.x
Clauset, A., Newman, M. E. J., and Moore, C. (2004). Finding community structure in very large networks. Phys. Rev. E 70:066111. doi: 10.1103/PhysRevE.70.066111
Csárdi, G., and Nepusz, T. (2006). The igraph software package for complex network research. Inter J. Complex Syst. 1695:1695.
Csermely, P. (2004). Strong links are important, but weak links stabilize them. Trends Biochem. Sci. 29, 331–334. doi: 10.1016/j.tibs.2004.05.004
Delmas, E., Besson, M., Brice, M.-H., Burkle, L. A., Dalla Riva, G. V., Fortin, M.-J., et al. (2019). Analysing ecological networks of species interactions. Biol. Rev. 94, 16–36. doi: 10.1111/brv.12433
Derocles, S. A. P., Bohan, D. A., Dumbrell, A. J., Kitson, J. J. N., Massol, F., Pauvert, C., et al. (2018). “Biomonitoring for the 21st century: integrating next-generation sequencing into ecological network analysis” in Next Generation Biomonitoring: Part 1 Advances in Ecological Research (Amsterdam, Netherlands: Elsevier Ltd), 1–62.
Dunne, J. A., Williams, R. J., and Martinez, N. D. (2002). Network structure and biodiversity loss in food webs: robustness increases with connectance. Ecol. Lett. 5, 558–567. doi: 10.1046/j.1461-0248.2002.00354.x
Elo, M., Ketola, T., and Komonen, A. (2021). Species co-occurrence networks of ground beetles in managed grasslands. Community Ecol. 22, 29–40. doi: 10.1007/s42974-020-00034-3
Evans, D. M., Kitson, J. J. N., Lunt, D. H., Straw, N. A., and Pocock, M. J. O. (2016). Merging DNA metabarcoding and ecological network analysis to understand and build resilient terrestrial ecosystems. Funct. Ecol. 30, 1904–1916. doi: 10.1111/1365-2435.12659
Fath, B. D., Asmus, H., Asmus, R., Baird, D., Borrett, S. R., de Jonge, V. N., et al. (2019). Ecological network analysis metrics: the need for an entire ecosystem approach in management and policy. Ocean Coastal Manag. 174, 1–14. doi: 10.1016/j.ocecoaman.2019.03.007
Fernández-Palacios, J. M., Kreft, H., Irl, S. D. H., Norder, S., Ah-Peng, C., Borges, P. A. V., et al. (2021). Scientists’ warning – the outstanding biodiversity of islands is in peril. Global Ecol. Conserv. 31:e01847. doi: 10.1016/j.gecco.2021.e01847
Florencio, M., Lobo, J. M., Cardoso, P., Almeida-Neto, M., and Borges, P. A. V. (2015). The colonisation of exotic species does not have to trigger faunal homogenisation: lessons from the assembly patterns of arthropods on oceanic islands. PLoS One 10:e0128276. doi: 10.1371/journal.pone.0128276
Freilich, M. A., Wieters, E., Broitman, B. R., Marquet, P. A., and Navarrete, S. A. (2018). Species co-occurrence networks: can they reveal trophic and non-trophic interactions in ecological communities? Ecology 99, 690–699. doi: 10.1002/ecy.2142
Fridley, J. D., Vandermast, D. B., Kuppinger, D. M., Manthey, M., and Peet, R. K. (2007). Co-occurrence based assessment of habitat generalists and specialists: a new approach for the measurement of niche width. J. Ecol. 95, 707–722. doi: 10.1111/j.1365-2745.2007.01236.x
Gaspar, C., Borges, P. A. V., and Gaston, K. J. (2008). Diversity and distribution of arthropods in native forests of the Azores archipelago. Arquipelago Life Marine Sci. 25, 1–30.
Gaston, K. J., Borges, P., He, F., and Gaspar, C. (2006). Abundance, spatial variance and occupancy: arthropod species distribution in the Azores. J. Anim. Ecol. 75, 646–656. doi: 10.1111/j.1365-2656.2006.01085.x
Gillespie, R. G., and Roderick, G. K. (2002). Arthropods on islands: colonization, speciation, and conservation. Annu. Rev. Entomol. 47, 595–632. doi: 10.1146/annurev.ento.47.091201.145244
Goberna, M., and Verdú, M. (2022). Cautionary notes on the use of co-occurrence networks in soil ecology. Soil Biol. Biochem. 166:108534. doi: 10.1016/j.soilbio.2021.108534
Griffith, D. M., Veech, J. A., and Marsh, C. J. (2016). Cooccur: probabilistic species co-occurrence analysis in R. J. Stat. Softw. 69, 1–17. doi: 10.18637/jss.v069.c02
Heleno, R. H., Ramos, J. A., and Memmott, J. (2013). Integration of exotic seeds into an Azorean seed dispersal network. Biol. Invasions 15, 1143–1154. doi: 10.1007/s10530-012-0357-z
Heleno, R. H., Ripple, W. J., and Traveset, A. (2020). Scientists’ warning on endangered food webs. Web Ecol. 20, 1–10. doi: 10.5194/we-20-1-2020
Hines, J., van der Putten, W. H., De Deyn, G. B., Wagg, C., Voigt, W., Mulder, C., et al. (2015). “Towards an integration of biodiversity–ecosystem functioning and food web theory to evaluate relationships between multiple ecosystem services” in Advances in Ecological Research Ecosystem Services. eds. G. Woodward and D. A. Bohan (Cambridge, MA: Academic Press), 161–199.
Hui, C. (2021). Introduced species shape insular mutualistic networks. PNAS 118:e2026396118. doi: 10.1073/pnas.2026396118
Hui, C., and Richardson, D. M. (2018). How to invade an ecological network. Trends Ecol. Evol. 34, 121–131. doi: 10.1016/j.tree.2018.11.003
Kay, G. M., Tulloch, A., Barton, P. S., Cunningham, S. A., Driscoll, D. A., and Lindenmayer, D. B. (2018). Species co-occurrence networks show reptile community reorganization under agricultural transformation. Ecography 41, 113–125. doi: 10.1111/ecog.03079
Kurtz, Z. D., Bonneau, R., and Müller, C. L. (2019). Disentangling microbial associations from hidden environmental and technical factors via latent graphical models. BioRxiv. doi: 10.1101/2019.12.21.885889
Kurtz, Z. D., Müller, C. L., Miraldi, E. R., Littman, D. R., Blaser, M. J., and Bonneau, R. A. (2015). Sparse and compositionally robust inference of microbial ecological networks. PLoS Comput. Biol. 11:e1004226. doi: 10.1371/journal.pcbi.1004226
Kuznetsova, A., Brockhoff, P. B., and Christensen, R. H. B. (2017). lmerTest package: tests in linear mixed effects models. J. Stat. Softw. 82, 1–26. doi: 10.18637/jss.v082.i13
Laliberté, E., and Tylianakis, J. M. (2010). Deforestation homogenizes tropical parasitoid–host networks. Ecology 91, 1740–1747. doi: 10.1890/09-1328.1
Larson, D. L., Rabie, P. A., Droege, S., Larson, J. L., and Haar, M. (2016). Exotic plant infestation is associated with decreased modularity and increased numbers of connectors in mixed-grass prairie pollination networks. PLoS One 11:e0155068. doi: 10.1371/journal.pone.0155068
Lima-Mendez, G., Faust, K., Henry, N., Decelle, J., Colin, S., Carcillo, F., et al. (2015). Determinants of community structure in the global plankton interactome. Science 348:1262073. doi: 10.1126/science.1262073
Ma, B., Wang, H., Dsouza, M., Lou, J., He, Y., Dai, Z., et al. (2016). Geographic patterns of co-occurrence network topological features for soil microbiota at continental scale in eastern China. ISME J. 10, 1891–1901. doi: 10.1038/ismej.2015.261
Matthews, T. J. (2021). On the biogeography of habitat islands: the importance of matrix effects, noncore species, and source-sink dynamics. Q. Rev. Biol. 96, 73–104. doi: 10.1086/714482
McMurdie, P. J., and Holmes, S. (2013). Phyloseq: an R package for reproducible interactive analysis and graphics of microbiome census data. PLoS One 8:e61217. doi: 10.1371/journal.pone.0061217
Oksanen, J., Blanchet, F. G., Kindt, R., Legendre, P., O’Hara, R. G., Simpson, G. L., et al. (2010). Vegan: Community ecology package. Available at: http://cran.r-project.org/package=vegan (Accessed September 26, 2022).
Okuyama, T., and Holland, J. N. (2008). Network structural properties mediate the stability of mutualistic communities. Ecol. Lett. 11, 208–216. doi: 10.1111/j.1461-0248.2007.01137.x
Ovaskainen, O., Abrego, N., Halme, P., and Dunson, D. (2016). Using latent variable models to identify large networks of species-to-species associations at different spatial scales. Methods Ecol. Evol. 7, 549–555. doi: 10.1111/2041-210X.12501
Poisot, T., Stouffer, D. B., and Gravel, D. (2015). Beyond species: Why ecological interaction networks vary through space and time. Oikos 124, 243–251. doi: 10.1111/oik.01719
Pozsgai, G., Baird, J., Littlewood, N. A., Pakeman, R. J., and Young, M. (2016). Interspecific networks in ground beetle (Coleoptera: Carabidae) assemblages. Ecol. Indic. 68, 134–141. doi: 10.1016/j.ecolind.2015.11.031
Pyšek, P., Hulme, P. E., Simberloff, D., Bacher, S., Blackburn, T. M., Carlton, J. T., et al. (2020). Scientists’ warning on invasive alien species. Biol. Rev. 95, 1511–1534. doi: 10.1111/brv.12627
R Core Team (2012). R: A language and environment for statistical computing. Available at: http://www.r-project.org/ (Accessed June 26, 2022).
Rego, C., Boieiro, M., Rigal, F., Ribeiro, S. P., Cardoso, P., and Borges, P. A. V. (2019). Taxonomic and functional diversity of insect herbivore assemblages associated with the canopy-dominant trees of the Azorean native forest. PLoS One 14:e0219493. doi: 10.1371/journal.pone.0219493
Ribeiro, S. P., Borges, P. A. V., Gaspar, C., Melo, C., Serrano, A. R. M., Amaral, J., et al. (2005). Canopy insect herbivores in the Azorean Laurisilva forests: key host plant species in a highly generalist insect community. Ecography 28, 315–330. doi: 10.1111/j.0906-7590.2005.04104.x
Rigal, F., Cardoso, P., Lobo, J. M., Triantis, K. A., Whittaker, R. J., Amorim, I. R., et al. (2018). Functional traits of indigenous and exotic ground-dwelling arthropods show contrasting responses to land-use change in an oceanic island, Terceira, Azores. Divers. Distrib. 24, 36–47. doi: 10.1111/ddi.12655
Rocha, J. C., Peterson, G. D., and Biggs, R. (2015). Regime shifts in the Anthropocene: drivers, risks, and resilience. PLoS One 10:e0134639. doi: 10.1371/journal.pone.0134639
Sax, D. F., Gaines, S. D., and Brown, J. H. (2002). Species invasions exceed extinctions on islands worldwide: a comparative study of plants and birds. Am. Nat. 160, 766–783. doi: 10.1086/343877
Strydom, T., Catchen, M. D., Banville, F., Caron, D., Dansereau, G., Desjardins-Proulx, P., et al. (2021). A roadmap toward predicting species interaction networks (across space and time). Philos. Trans. Royal Soc. B Biol. Sci. 376:20210063. doi: 10.1098/rstb.2021.0063
Tikhonov, G., Abrego, N., Dunson, D., and Ovaskainen, O. (2017). Using joint species distribution models for evaluating how species-to-species associations depend on the environmental context. Methods Ecol. Evol. 8, 443–452. doi: 10.1111/2041-210X.12723
Triantis, K. A., Borges, P. A. V., Ladle, R. J., Hortal, J., Cardoso, P., Gaspar, C., et al. (2010). Extinction debt on oceanic islands. Ecography 33, 285–294. doi: 10.1111/j.1600-0587.2010.06203.x
Tsafack, N., Pozsgai, G., Boieiro, M., Ros-Prieto, A., Nunes, R., Ferreira, M. T., et al. (2023). Edge effects constraint endemic but not introduced arthropod species in a pristine forest on Terceira (Azores, Portugal). For. Ecol. Manag. 528:120646. doi: 10.1016/j.foreco.2022.120646
Tulloch, A. I. T., Chadès, I., Dujardin, Y., Westgate, M. J., Lane, P. W., and Lindenmayer, D. (2016). Dynamic species co-occurrence networks require dynamic biodiversity surrogates. Ecography 39, 1185–1196. doi: 10.1111/ecog.02143
Turquin, M. J. (1973). “Une biocenose cavernicole originale pour le Bugey: le puits de Rappe” in Comptes Rendus 96e Congresse Naturel Societes Savantes (Sciences: Toulouse, France), 235–256.
Tylianakis, J. M., Laliberté, E., Nielsen, A., and Bascompte, J. (2010). Conservation of species interaction networks. Biol. Conserv. 143, 2270–2279. doi: 10.1016/j.biocon.2009.12.004
Valido, A., and Olesen, J. M. (2022). “Pollination on islands: examples from the Macaronesian archipelagos” in Terrestrial Arthropods of Macaronesia – Biodiversity, Ecology and Evolution. eds. A. R. M. Serrano, P. A. V. Borges, M. Boieiro, and P. Oromí (Lisbon, Portugal: Fundação para a Ciência e a Tecnologia), 249–283.
Valiente-Banuet, A., Aizen, M. A., Alcántara, J. M., Arroyo, J., Cocucci, A., Galetti, M., et al. (2015). Beyond species loss: the extinction of ecological interactions in a changing world. Funct. Ecol. 29, 299–307. doi: 10.1111/1365-2435.12356
Veech, J. A. (2006). A probability-based analysis of temporal and spatial co-occurrence in grassland birds. J. Biogeogr. 33, 2145–2153. doi: 10.1111/j.1365-2699.2006.01571.x
Whittaker, R. J., Fernández-Palacios, J. M., Matthews, T. J., Borregaard, M. K., and Triantis, K. A. (2017). Island biogeography: taking the long view of nature’s laboratories. Science 357:eaam8326. doi: 10.1126/science.aam8326
Whittaker, R. J., Rigal, F., Borges, P. A. V., Cardoso, P., Terzopoulou, S., Casanoves, F., et al. (2014). Functional biogeography of oceanic islands and the scaling of functional diversity in the Azores. PNAS 111, 13709–13714. doi: 10.1073/pnas.1218036111
Wickham, H. (2007). Reshaping data with the reshape package. J. Stat. Softw. 21:i12. doi: 10.18637/jss.v021.i12
Keywords: exotic species, network complexity, modularity, island introductions, native fauna
Citation: Pozsgai G, Cardoso P, Rigal F, Boieiro M, Gabriel R, de Azevedo EB and Borges PAV and (2023) Arthropod co-occurrence networks indicate environmental differences between islands and signal introduced species in Azorean native forest remnants. Front. Ecol. Evol. 11:1139285. doi: 10.3389/fevo.2023.1139285
Edited by:
Lawrence Hurd, Washington and Lee University, United StatesReviewed by:
Lucia Santorufo, University of Naples Federico II, ItalyMatthew Joseph Michalska-Smith, University of Minnesota Twin Cities, United States
Copyright © 2023 Pozsgai, Cardoso, Rigal, Boieiro, Gabriel, de Azevedo and Borges. This is an open-access article distributed under the terms of the Creative Commons Attribution License (CC BY). The use, distribution or reproduction in other forums is permitted, provided the original author(s) and the copyright owner(s) are credited and that the original publication in this journal is cited, in accordance with accepted academic practice. No use, distribution or reproduction is permitted which does not comply with these terms.
*Correspondence: Gabor Pozsgai, pozsgaig@coleoptera.hu